Hydrology Banner

Victoria Falls/Big Tree

Flows at Victoria Falls increased during the week under review before closing at 274m3/s on 16th December 2019. Last year on the same date, the flow was 227m3/s.

Date Flow(m3/s)
Date Flow(m3/s)
10/12/2019255
11/12/2019259
12/12/2019263
13/12/2019267
14/12/2019270
15/12/2019270
16/12/2019274
From: 
Tuesday, December 10, 2019
To: 
Monday, December 16, 2019
Lake Levels Graphic: 
Victoria Falls/Big Tree

Chavuma

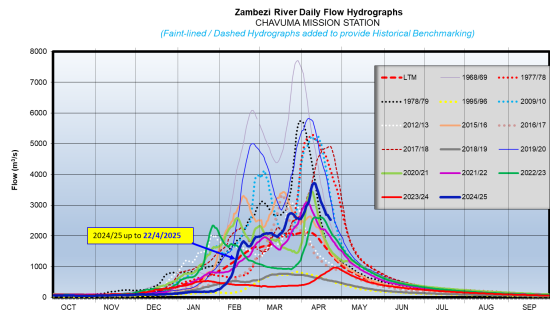
The Zambezi River flows at Chavuma are decreasing steadily, closing the period under review at 2,523m3/s as of 22nd April 2025, whilst last year on the same date it was much lower at 897m3/s.

From:
16 April 2025
To:
22 April 2025
DateFlow (m3/s)(2024/25)Flow (m3/s)(2023/24)
16-Apr3,019736
17-Apr2,916764
18-Apr2,803789
19-Apr2,692816
20-Apr2,682839
21-Apr2,601865
22-Apr2,523897
chavuma

Ngonye

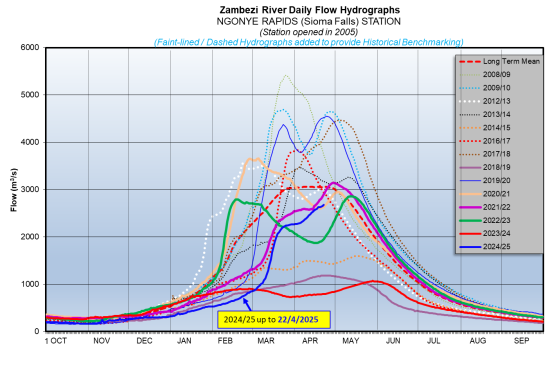
Flows at Ngonye are increasing steadily, closing the period under review at 2,673m3/s as of 22nd April 2025. The flow recorded last year on the same date was lower at 788m3/s.

From:
16 April 2025
To:
22 April 2025
DateFlow (m3/s)(2024/25)Flow (m3/s)(2023/24)
16-Apr2,580771
17-Apr2,596783
18-Apr2,626783
19-Apr2,629782
20-Apr2,633782
21-Apr2,650793
22-Apr2,673788
ngonye

Victoria Falls (Nana’s Farm Station)

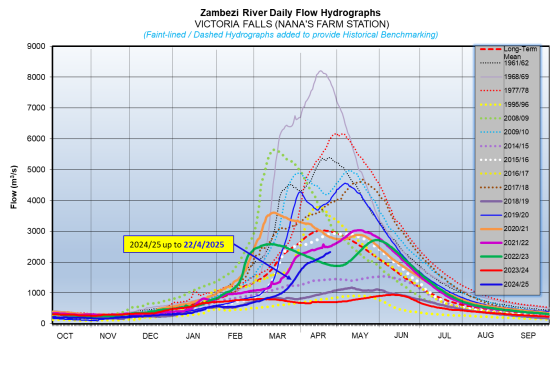
The Zambezi River flows at Victoria Falls – Nana’s Farm Station are increasing steadily, closing the period under review at 2,323m3/s on 22nd April 2025.  The flow observed on the same date last year was lower at 694m3/s.

From:
16 April 2025
To:
22 April 2025
DateFlow (m3/s)(2024/25)Flow (m3/s)(2023/24)
16-Apr2,165700
17-Apr2,182695
18-Apr2,223694
19-Apr2,275697
20-Apr2,273697
21-Apr2,297695
22-Apr2,323694
vic-falls