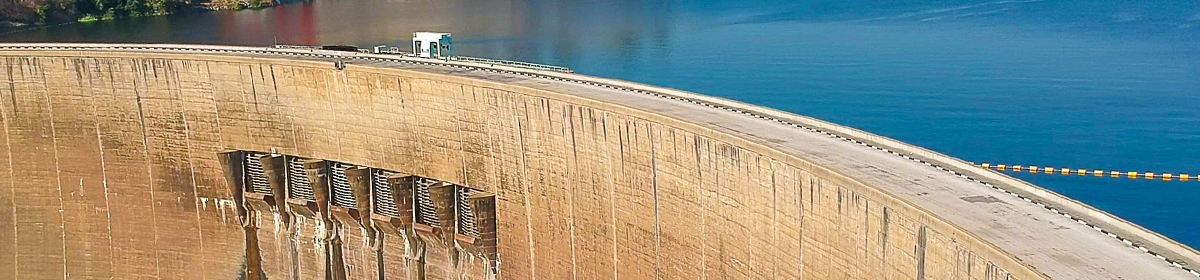
Kariba Reservoir Data
| Day | July 2024 | July 2025 | July 2026 | |||||||
| Lake | Percent | Lake | Percent | Lake | Live Storage | Percent | Turbine | Total | ||
| Level (m) | Full | Level (m) | Full | Level (m) | x 109 m3 | Full | Discharge (m3/s) | Spillage (m3/s) | Outflow (m3/s) | |
| 1 | 477.28 | 12.32% | 478.93 | 24.05% | 482.16 | 31.21 | 48.17% | 1,275 | 0 | 1,275 |
| 2 | 477.28 | 12.32% | 478.91 | 23.90% | 482.16 | 31.21 | 48.17% | 1,358 | 0 | 1,358 |
| 3 | 477.28 | 12.32% | 478.92 | 23.97% | 482.18 | 31.31 | 48.32% | 1,457 | 0 | 1,457 |
| 4 | 477.28 | 12.32% | 478.95 | 24.19% | 482.18 | 31.31 | 48.32% | 1,132 | 0 | 1,132 |
| 5 | 477.27 | 12.25% | 478.96 | 24.26% | 482.17 | 31.26 | 48.25% | 988 | 0 | 988 |
| 6 | 477.26 | 12.18% | 478.97 | 24.34% | 482.17 | 31.26 | 48.25% | 1,093 | 0 | 1,093 |
| 7 | 477.25 | 12.11% | 478.99 | 24.48% | 482.16 | 31.21 | 48.17% | 1,450 | 0 | 1,450 |
| 8 | 477.23 | 11.97% | 478.97 | 24.34% | 482.16 | 31.21 | 48.17% | 1,337 | 0 | 1,337 |
| 9 | 477.22 | 11.90% | 478.98 | 24.41% | 482.16 | 31.21 | 48.17% | 1,163 | 0 | 1,163 |
| 10 | 477.21 | 11.83% | 478.98 | 24.41% | 482.15 | 31.16 | 48.09% | 1,335 | 0 | 1,335 |
| 11 | 477.20 | 11.76% | 478.98 | 24.41% | 482.14 | 31.11 | 48.01% | 1,421 | 0 | 1,421 |
| 12 | 477.19 | 11.69% | 478.97 | 24.34% | 482.14 | 31.11 | 48.01% | 1,369 | 0 | 1,369 |
| 13 | 477.18 | 11.62% | 478.97 | 24.34% | 482.13 | 31.06 | 47.93% | 1,290 | 0 | 1,290 |
| 14 | 477.17 | 11.55% | 478.97 | 24.34% | 482.12 | 31.01 | 47.86% | 1,403 | 0 | 1,403 |
| 15 | 477.17 | 11.55% | 478.97 | 24.34% | 482.11 | 30.96 | 47.78% | 1,325 | 0 | 1,325 |
| 16 | 477.17 | 11.55% | 478.96 | 24.26% | 482.10 | 30.91 | 47.70% | 1,218 | 0 | 1,218 |
| 17 | 477.16 | 11.48% | 478.95 | 24.19% | 482.09 | 30.86 | 47.62% | 1,373 | 0 | 1,373 |
| 18 | 477.15 | 11.41% | 478.94 | 24.12% | 482.08 | 30.81 | 47.55% | 1,157 | 0 | 1,157 |
| 19 | 477.15 | 11.41% | 478.93 | 24.05% | 482.08 | 30.81 | 47.55% | 1,027 | 0 | 1,027 |
| 20 | 477.14 | 11.34% | 478.93 | 24.05% | 482.07 | 30.76 | 47.47% | 1,120 | 0 | 1,120 |
| 21 | 477.13 | 11.26% | 478.91 | 23.90% | 482.07 | 30.76 | 47.47% | 1,243 | 0 | 1,243 |
| 22 | 477.11 | 11.12% | 478.91 | 23.90% | 482.06 | 30.71 | 47.39% | 1,286 | 0 | 1,286 |
| 23 | 477.10 | 11.05% | 478.92 | 23.97% | 482.05 | 30.66 | 47.32% | 1,300 | 0 | 1,300 |
| 24 | 477.09 | 10.98% | 478.91 | 23.90% | 482.05 | 30.66 | 47.32% | 1,233 | 0 | 1,233 |
| 25 | 477.08 | 10.91% | 478.90 | 23.83% | 482.04 | 30.61 | 47.24% | 1,158 | 0 | 1,158 |
| 26 | 477.07 | 10.84% | 478.89 | 23.75% | 482.03 | 30.56 | 47.16% | 828 | 0 | 828 |
| 27 | 477.05 | 10.70% | 478.88 | 23.68% | 482.02 | 30.51 | 47.08% | 1,147 | 0 | 1,147 |
| 28 | 477.04 | 10.63% | 478.87 | 23.61% | 482.01 | 30.46 | 47.01% | |||
| 29 | 477.04 | 10.63% | 478.85 | 23.47% | ||||||
| 30 | 477.03 | 10.56% | 478.83 | 23.32% | ||||||
| 31 | 477.02 | 10.49% | 478.82 | 23.25% | ||||||