Hydrology Banner

River Flows

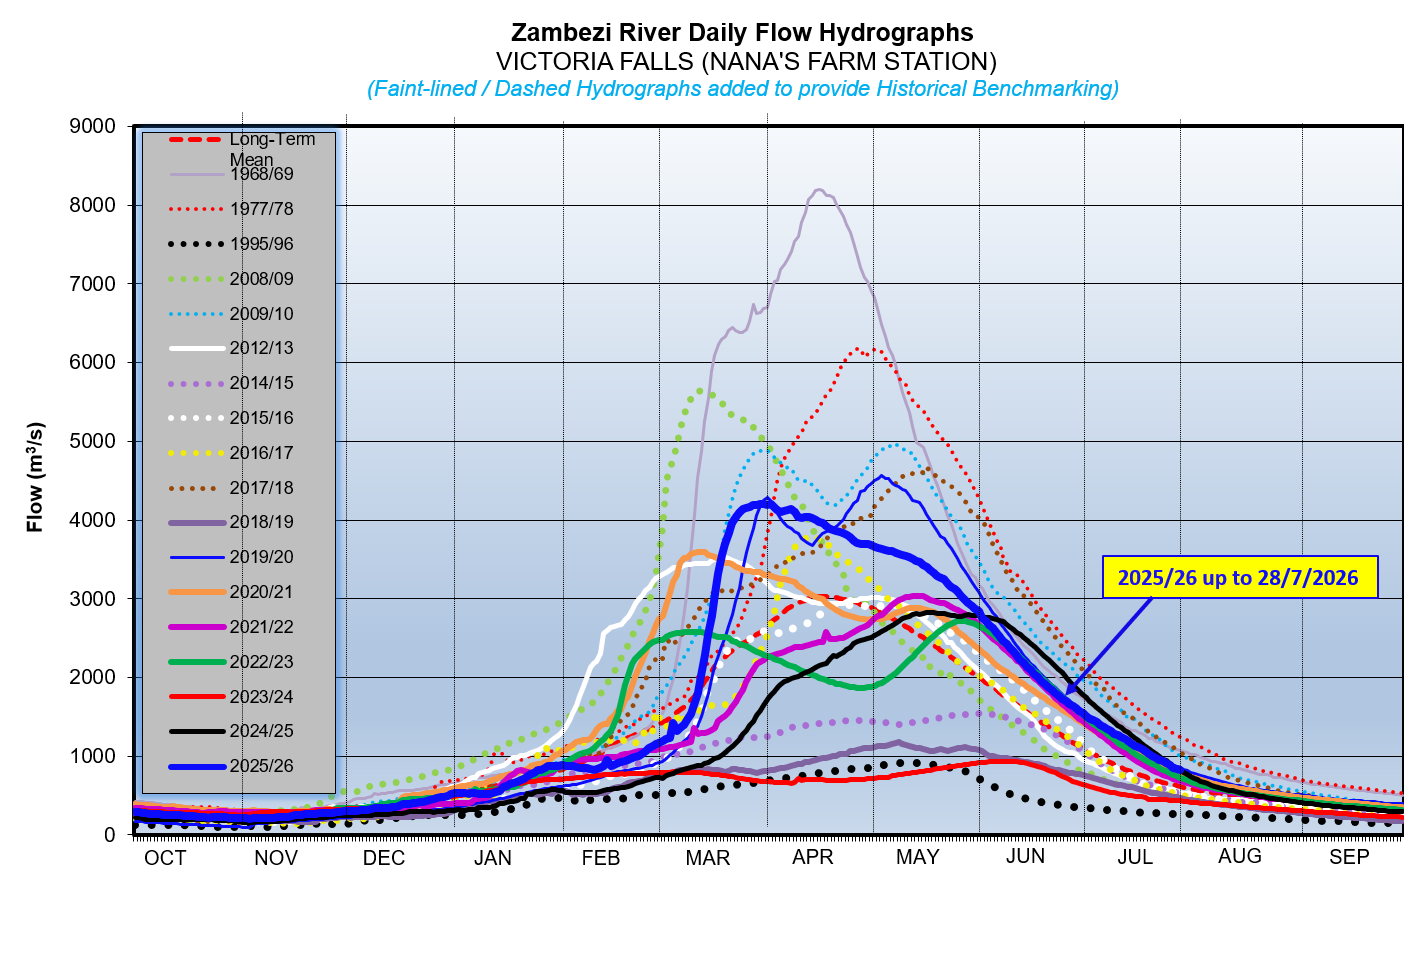
The hydrometric network used for the control and day to day operations of the Kariba reservoir comprise of thirteen stations where water levels are monitored daily. Flow measurements are carried out at eight of these stations which include the Victoria Falls, one of the key stations on the Zambezi River. Coincidentally, the maximum flow recorded at Victoria Falls was during the early construction phase of Kariba Dam in March 1958 at 10,000 cubic metres per second.  The lowest flows recorded to date at Victoria Falls were during the 1995/96 season which had an annual mean flow of 390 cubic metres per second, whereas the Long Term Mean Annual flow at Victoria Falls is 1,100 cubic metres per second.

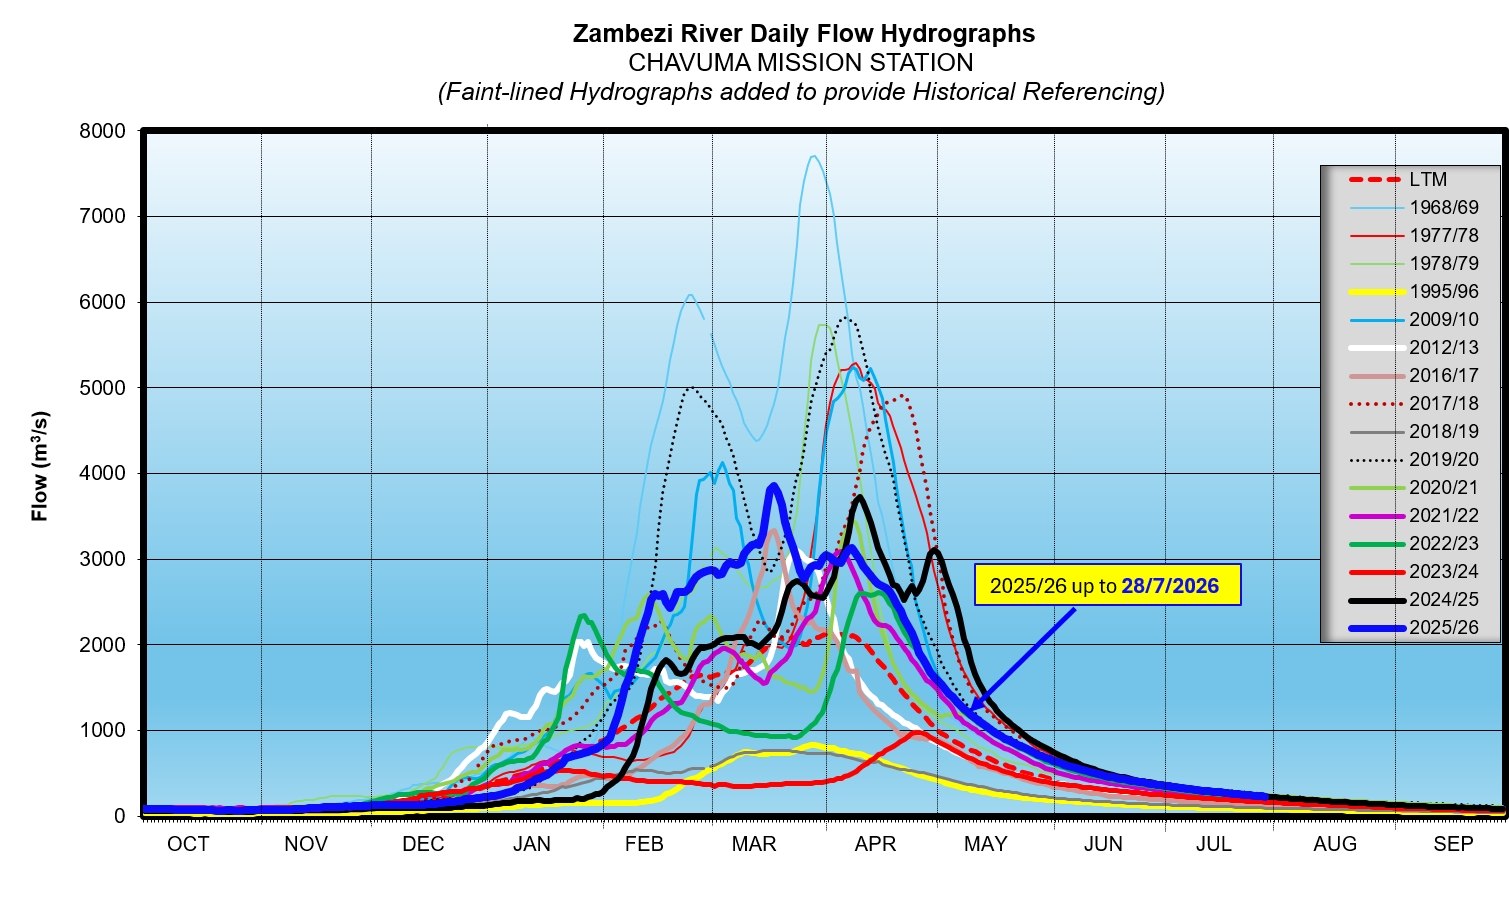
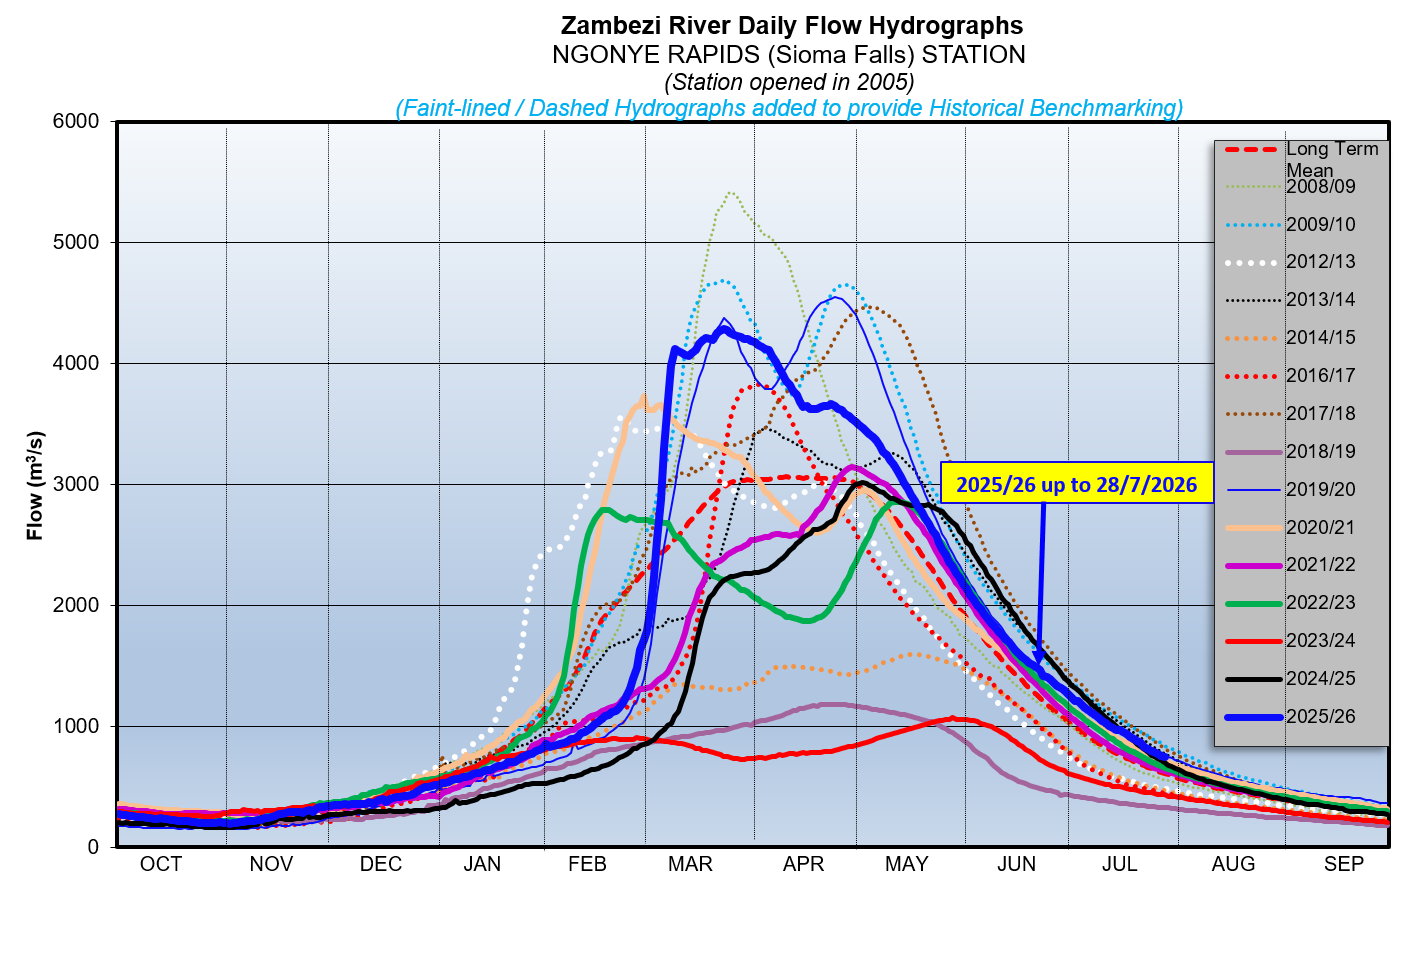
FLOWS AT SELECTED STATIONS:

Chavuma

The Zambezi River flows at Chavuma are rising steadily, with records of fluctuations being observed due to the influence of local rainfall activity, closing the period under review at 112m3/s as of 25th November 2025, whilst last year on the same date it was lower at 77m3/s.


From:
12 November 2025
To:
25 November 2025
DateFlow (m3/s)(2024/25)Flow (m3/s)(2023/24)
12-Nov8464
13-Nov8769
14-Nov9271
15-Nov9472
16-Nov9772
17-Nov9872
18-Nov10272
19-Nov10673
20-Nov10873
21-Nov11174
22-Nov10974
23-Nov11175
24-Nov11375
25-Nov11277

Ngonye

Flows at Ngonye are increasing with records of fluctuation being observed due to local rainfall activity, closing the period under review at 303m3/s as of 25th November 2025. The flow recorded last year on the same date was lower at 247m3/s.

From:
12 November 2025
To:
25 November 2025
DateFlow (m3/s)(2024/25)Flow (m3/s)(2023/24)
12-Nov238191
13-Nov241198
14-Nov253202
15-Nov257222
16-Nov274235
17-Nov276236
18-Nov282229
19-Nov286227
20-Nov288230
21-Nov292235
22-Nov292235
23-Nov283240
24-Nov299267
25-Nov303247

Victoria Falls (Nana’s Farm Station)

Flows at Ngonye are increasing with records of fluctuation being observed due to local rainfall activity, closing the period under review at 303m3/s as of 25th November 2025. The flow recorded last year on the same date was lower at 247m3/s.

From:
12 November 2025
To:
25 November 2025
DateFlow (m3/s)(2024/25)Flow (m3/s)(2023/24)
12-Nov238191
13-Nov241198
14-Nov253202
15-Nov257222
16-Nov274235
17-Nov276236
18-Nov282229
19-Nov286227
20-Nov288230
21-Nov292235
22-Nov292235
23-Nov283240
24-Nov299267
25-Nov303247