Hydrology Banner

Victoria Falls

The Zambezi River flows at Victoria Falls are now decreasing, closing the period under review at 1,675m3/s on 26th June 2023. The flow observed on the same date last year was 1,582m3/s.

13-Jun2,2122,128
14-Jun2,1672,082
15-Jun2,1222,046
16-Jun2,0822,000
17-Jun2,0401,959
18-Jun1,9981,917
19-Jun1,9591,872
20-Jun1,9191,834
21-Jun1,8741,786
22-Jun1,8361,746
23-Jun1,7901,700
24-Jun1,7541,663
25-Jun1,7161,624
26-Jun1,6751,582
From: 
Tuesday, June 13, 2023
To: 
Monday, June 26, 2023
Lake Levels Graphic: 

Chavuma

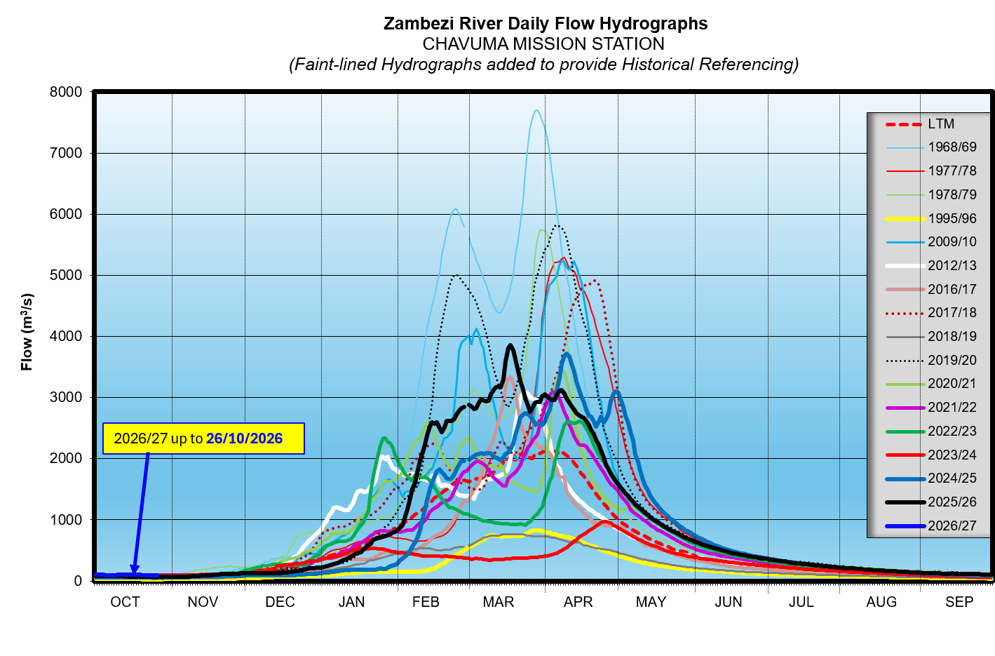
The Zambezi River flows at Chavuma are in recession, closing the period under review at 186m3/s as of 10th August 2026, whilst last year on the same date it was at 186m3/s.

From:
28 July 2026
To:
10 August 2026
DateFlow (m3/s)(2025/26)Flow (m3/s)(2024/25)
28-Jul228229
29-Jul223226
30-Jul220222
31-Jul217218
1-Aug212215
2-Aug209211
3-Aug207208
4-Aug204203
5-Aug202201
6-Aug199199
7-Aug196196
8-Aug191192
9-Aug189189
10-Aug186186

Ngonye

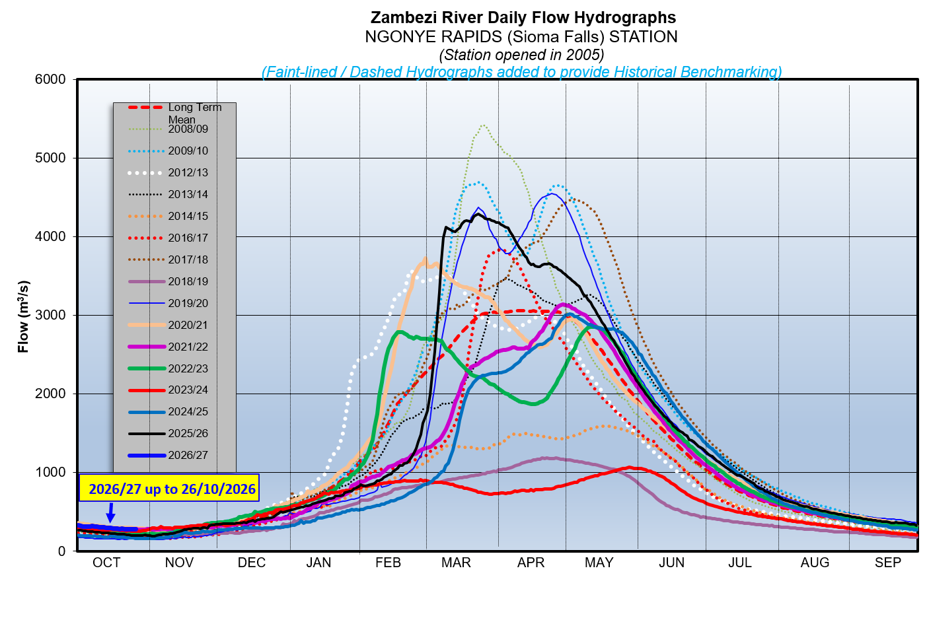
Flows at Ngonye are steadily decreasing, closing the period under review at 590m3/s as of 10th August 2026. The flow recorded last year on the same date was at 539m3/s.

From:
28 July 2026
To:
10 August 2026
DateFlow (m3/s)(2025/26)Flow (m3/s)(2024/25)
28-Jul741700
29-Jul726677
30-Jul710663
31-Jul695650
1-Aug685638
2-Aug674625
3-Aug658609
4-Aug649599
5-Aug635590
6-Aug631577
7-Aug618570
8-Aug609555
9-Aug600545
10-Aug590539

Victoria Falls (Nana’s Farm Station)

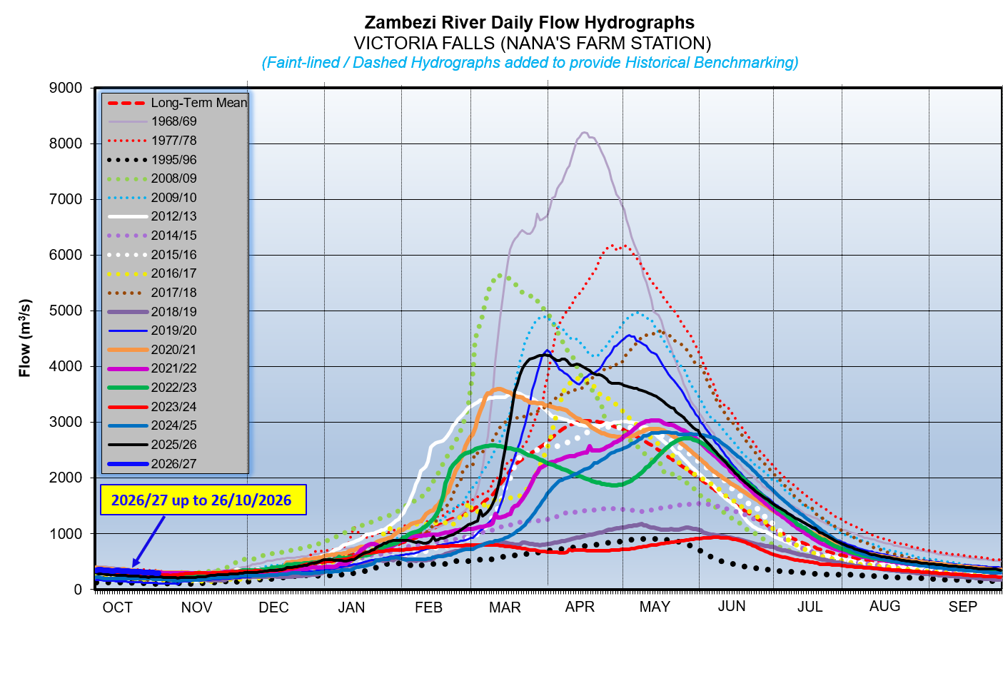
The Zambezi River flows at Victoria Falls – Nana’s Farm Station are steadily decreasing, closing the period under review at 624m3/s as of 10th August 2026.  The flow observed on the same date last year was at 581m3/s.

From:
28 July 2026
To:
10 August 2026
DateFlow (m3/s)(2025/26)Flow (m3/s)(2024/25)
28-Jul822814
29-Jul808788
30-Jul785764
31-Jul769744
1-Aug752721
2-Aug733701
3-Aug720675
4-Aug703665
5-Aug691648
6-Aug674626
7-Aug661616
8-Aug641606
9-Aug631594
10-Aug624581