| Date | Flow (m3/s) 2020 | Flow (m3/s) 2019 |
|---|---|---|
| 22-Sep | 419 | 198 |
| 23-Sep | 414 | 195 |
| 24-Sep | 411 | 192 |
| 25-Sep | 405 | 189 |
| 26-Sep | 405 | 186 |
| 27-Sep | 404 | 183 |
| 28-Sep | 403 | 180 |
| 29-Sep | 398 | 177 |
| 30-Sep | 395 | 174 |
| 1-Oct | 391 | 171 |
| 2-Oct | 386 | 168 |
| 3-Oct | 381 | 165 |
| 4-Oct | 379 | 163 |
| 5-Oct | 376 | 163 |

The Zambezi River flows at Chavuma are rising steadily, with records of fluctuations being observed due to the influence of local rainfall activity, closing the period under review at 259m3/s as of 5th January 2026, whilst last year on the same date it was lower at 150m3/s.
| Date | Flow (m3/s)(2024/25) | Flow (m3/s)(2023/24) |
|---|---|---|
| 23-Dec | 168 | 104 |
| 24-Dec | 173 | 107 |
| 25-Dec | 179 | 109 |
| 26-Dec | 197 | 113 |
| 27-Dec | 204 | 113 |
| 28-Dec | 203 | 118 |
| 29-Dec | 208 | 119 |
| 30-Dec | 214 | 121 |
| 31-Dec | 218 | 124 |
| 1-Jan | 224 | 131 |
| 2-Jan | 233 | 134 |
| 3-Jan | 238 | 136 |
| 4-Jan | 249 | 144 |
| 5-Jan | 259 | 150 |

Flows at Ngonye are increasing with records of fluctuation being observed due to local rainfall activity, closing the period under review at 552m3/s as of 5th January 2026. The flow recorded last year on the same date was lower at 359m3/s.
| Date | Flow (m3/s)(2024/25) | Flow (m3/s)(2023/24) |
|---|---|---|
| 23-Dec | 422 | 300 |
| 24-Dec | 427 | 298 |
| 25-Dec | 439 | 300 |
| 26-Dec | 461 | 303 |
| 27-Dec | 476 | 301 |
| 28-Dec | 499 | 303 |
| 29-Dec | 494 | 302 |
| 30-Dec | 503 | 311 |
| 31-Dec | 513 | 315 |
| 1-Jan | 517 | 322 |
| 2-Jan | 527 | 328 |
| 3-Jan | 534 | 330 |
| 4-Jan | 542 | 344 |
| 5-Jan | 552 | 359 |

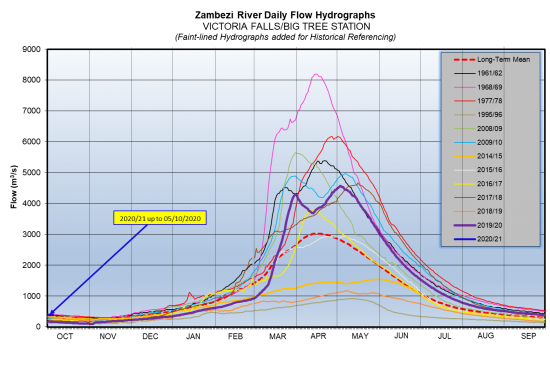
The Zambezi River flows at Victoria Falls – Nana’s Farm Station are steadily rising, closing the period under review at 525m3/s as of 5th January 2026. The flow observed on the same date last year was lower at 320m3/s.
| Date | Flow (m3/s)(2024/25) | Flow (m3/s)(2023/24) |
|---|---|---|
| 23-Dec | 425 | 292 |
| 24-Dec | 436 | 292 |
| 25-Dec | 438 | 292 |
| 26-Dec | 453 | 289 |
| 27-Dec | 471 | 292 |
| 28-Dec | 477 | 303 |
| 29-Dec | 483 | 296 |
| 30-Dec | 496 | 305 |
| 31-Dec | 518 | 308 |
| 1-Jan | 530 | 310 |
| 2-Jan | 535 | 320 |
| 3-Jan | 534 | 312 |
| 4-Jan | 530 | 313 |
| 5-Jan | 525 | 320 |
