Hydrology Banner

Victoria Falls / Big Tree

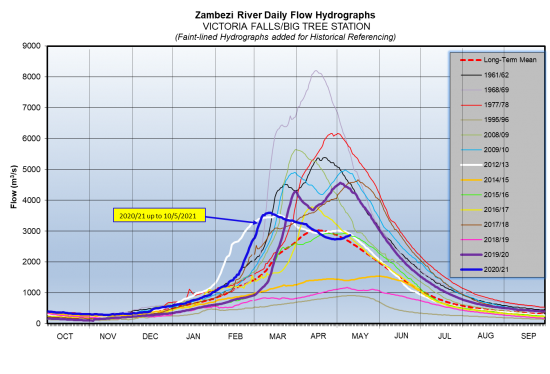
The Zambezi River flows at Victoria Falls have started increasing due to second wave of incoming inflows from the upper Kariba catchment, closing the period under review at 2,870m3/s on 10th May 2021. The flow observed on the same date last year was 4,375m3/s.

DateFlow (m3/s) 2020/21Flow (m3/s) 2019/20
27/4/20212,7484,358
28/4/20212,7414,375
29/4/20212,7344,427
30/4/20212,7374,462
1/5/20212,7384,497
2/5/20212,7454,532
3/5/20212,7454,568
4/5/20212,7574,532
5/5/20212,7694,532
6/5/20212,7924,462
7/5/20212,8164,444
8/5/20212,8304,427
9/5/20212,8464,392
10/5/20212,8704,375
From: 
Tuesday, April 27, 2021
To: 
Monday, May 10, 2021
Lake Levels Graphic: 
vic-falls

Chavuma

The Zambezi River flows at Chavuma are increasing again steadily as the rainfall season progresses, closing the period under review at 2,969m3/s as of 6th March 2026, whilst last year on the same date it was lower at 2,085m3/s.

From:
21 February 2026
To:
6 March 2026
DateFlow (m3/s)(2024/25)Flow (m3/s)(2023/24)
21-Feb2,6181,673
22-Feb2,6191,661
23-Feb2,6191,673
24-Feb2,6511,740
25-Feb2,7181,821
26-Feb2,7861,906
27-Feb2,8211,964
28-Feb2,8441,964
1-Mar2,8791,982
2-Mar2,8602,009
3-Mar2,8102,039
4-Mar2,8252,062
5-Mar2,9182,078
6-Mar2,9692,085

Ngonye

Flows at Ngonye are increasing, closing the period under review at 3,289m3/s as of 6th March 2026. The flow recorded last year on the same date was lower at 973m3/s.


From:
21 February 2026
To:
6 March 2026
DateFlow (m3/s)(2024/25)Flow (m3/s)(2023/24)
21-Feb1,126713
22-Feb1,151740
23-Feb1,196752
24-Feb1,243766
25-Feb1,311780
26-Feb1,390812
27-Feb1,481813
28-Feb1,628841
1-Mar1,791860
2-Mar1,991877
3-Mar2,232890
4-Mar2,536926
5-Mar2,871946
6-Mar3,289973

Victoria Falls (Nana’s Farm Station)

The Zambezi River flows at Victoria Falls – Nana’s Farm Station are increasing again as rainfall season progresses, closing the period under review at 1,357m3/s as of 6th March 2026.  The flow observed on the same date last year was lower at 822m3/s.

From:
21 February 2026
To:
6 March 2026
DateFlow (m3/s)(2024/25)Flow (m3/s)(2023/24)
21-Feb971624
22-Feb988650
23-Feb1,006664
24-Feb1,030680
25-Feb1,065692
26-Feb1,102705
27-Feb1,124719
28-Feb1,159727
1-Mar1,188721
2-Mar1,216752
3-Mar1,228769
4-Mar1,421787
5-Mar1,323805
6-Mar1,357822