Hydrology Banner

Victoria Falls / Big Tree

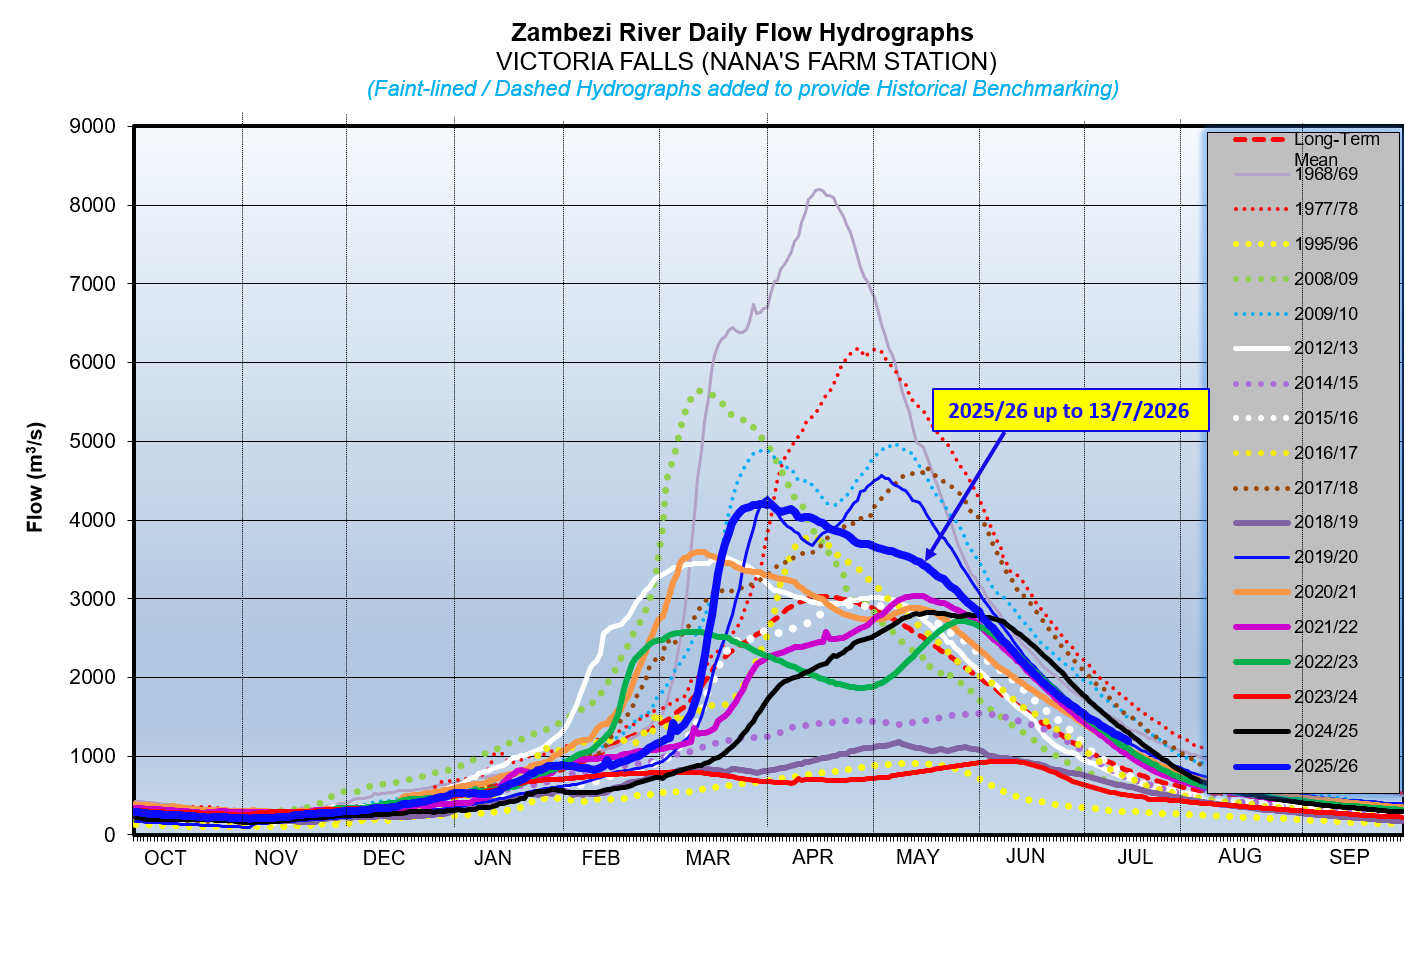
The Zambezi River flows at Victoria Falls which have been increasing due to second wave of incoming inflows from the upper Kariba catchment, have started decreasing and closing the period under review at 2,555m3/s on 26th May 2021. The flow observed on the same date last year was 3,412m3/s.

DateFlow (m3/s) 2020/21Flow (m3/s) 2019/20
13/5/20212,8774,238
14/5/20212,8794,221
15/5/20212,8744,153
16/5/20212,8634,066
17/5/20212,8514,000
18/5/20212,8323,926
19/5/20212,8063,857
20/5/20212,7733,793
21/5/20212,7433,762
22/5/20212,7203,699
23/5/20212,6713,636
24/5/20212,6233,575
25/5/20212,5843,514
26/5/20212,5553,412
From: 
Thursday, May 13, 2021
To: 
Wednesday, May 26, 2021
Lake Levels Graphic: 
vic-falls

Chavuma

The Zambezi River flows at Chavuma are rising steadily, with records of fluctuations being observed due to the influence of local rainfall activity, closing the period under review at 78m3/s as of 10th November 2025, whilst last year on the same date it was lower at 64m3/s.

From:
28 October 2025
To:
10 November 2025
DateFlow (m3/s)(2024/25)Flow (m3/s)(2023/24)
28-Oct6652
29-Oct6853
30-Oct6853
31-Oct6854
1-Nov6957
2-Nov7159
3-Nov7059
4-Nov7061
5-Nov6962
6-Nov7461
7-Nov7363
8-Nov7463
9-Nov7565
10-Nov7864

Ngonye

Flows at Ngonye are increasing with records of fluctuation being observed due to local rainfall activity, closing the period under review at 224m3/s as of 10th November 2025. The flow recorded last year on the same date was lower at 186m3/s.

From:
28 October 2025
To:
10 November 2025
DateFlow (m3/s)(2024/25)Flow (m3/s)(2023/24)
28-Oct6652
29-Oct6853
30-Oct6853
31-Oct6854
1-Nov6957
2-Nov7159
3-Nov7059
4-Nov7061
5-Nov6962
6-Nov7461
7-Nov7363
8-Nov7463
9-Nov7565
10-Nov7864

Victoria Falls (Nana’s Farm Station)

The Zambezi River flows at Victoria Falls – Nana’s Farm Station are in recession, with isolated rises being observed due to local rainfall activity, closing the period under review at 219m3/s as of 10th November 2025.  The flow observed on the same date last year was lower at 171m3/s.

From:
28 October 2025
To:
10 November 2025
DateFlow (m3/s)(2024/25)Flow (m3/s)(2023/24)
28-Oct220180
29-Oct219178
30-Oct214174
31-Oct212169
1-Nov212163
2-Nov211162
3-Nov206162
4-Nov212164
5-Nov217166
6-Nov220167
7-Nov216168
8-Nov216170
9-Nov217172
10-Nov219171