Hydrology Banner

Victoria Falls / Big Tree

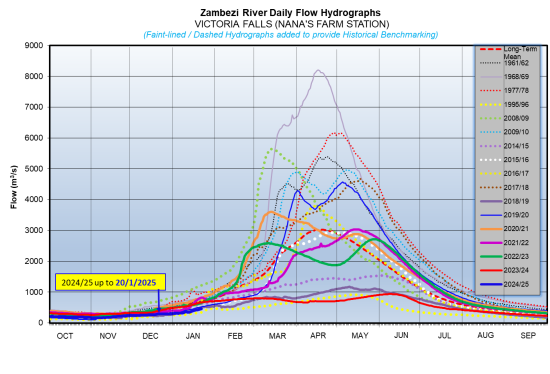
The Zambezi River flows at Victoria Falls are steadily increasing with records of fluctuation due to rainfall activities being observed around the catchment of interest, closing the period under review at 458m3/s on 20th January 2025.  The flow observed on the same date last year was higher at 660m3/s.

DateFlow (m3/s)(2024/25)Flow (m3/s)(2023/24)
7-Jan325527
8-Jan351531
9-Jan351538
10-Jan347547
11-Jan349559
12-Jan356570
13-Jan378579
14-Jan397591
15-Jan401606
16-Jan415623
17-Jan420641
18-Jan431654
19-Jan441658
20-Jan458660
From: 
Tuesday, January 7, 2025
To: 
Monday, January 20, 2025
Lake Levels Graphic: 
vic-falls

Chavuma

The Zambezi River flows at Chavuma have been fluctuating because of variation in rainfall activity around the catchment of interest, closing the period under review at 2,088m3/s on 10th March 2025 whilst last year on the same date it was much lower at 344m3/s.

From:
4 March 2025
To:
10 March 2025
DateFlow (m3/s)(2024/25)Flow (m3/s)(2023/24)
4-Mar2,062369
5-Mar2,078366
6-Mar2,085357
7-Mar2,076350
8-Mar2,086347
9-Mar2,089343
10-Mar2,088344
chavuma

Ngonye

Flows at Ngonye are increasing steadily due to rainfall activity on the catchment, closing the period under review at 1,122m3/s as of 10th March 2025. The flow recorded last year on the same date was lower at 859m3/s.

From:
4 March 2025
To:
10 March 2025
DateFlow (m3/s)(2024/25)Flow (m3/s)(2023/24)
4-Mar926878
5-Mar946878
6-Mar973877
7-Mar1,007875
8-Mar1,023867
9-Mar1,083865
10-Mar1,122859
ngonye

Victoria Falls (Nana’s Farm Station)

The Zambezi River flows at Victoria Falls – Nana’s Farm Station are increasing steadily, closing the period under review at 871m3/s on 10th March 2025.  The flow observed on the same date last year was lower at 793m3/s.

From:
4 March 2025
To:
10 March 2025
DateFlow (m3/s)(2024/25)Flow (m3/s)(2023/24)
4-Mar787800
5-Mar805796
6-Mar822794
7-Mar836796
8-Mar845794
9-Mar856793
10-Mar871793
vic-falls