Hydrology Banner

Victoria Falls / Big Tree

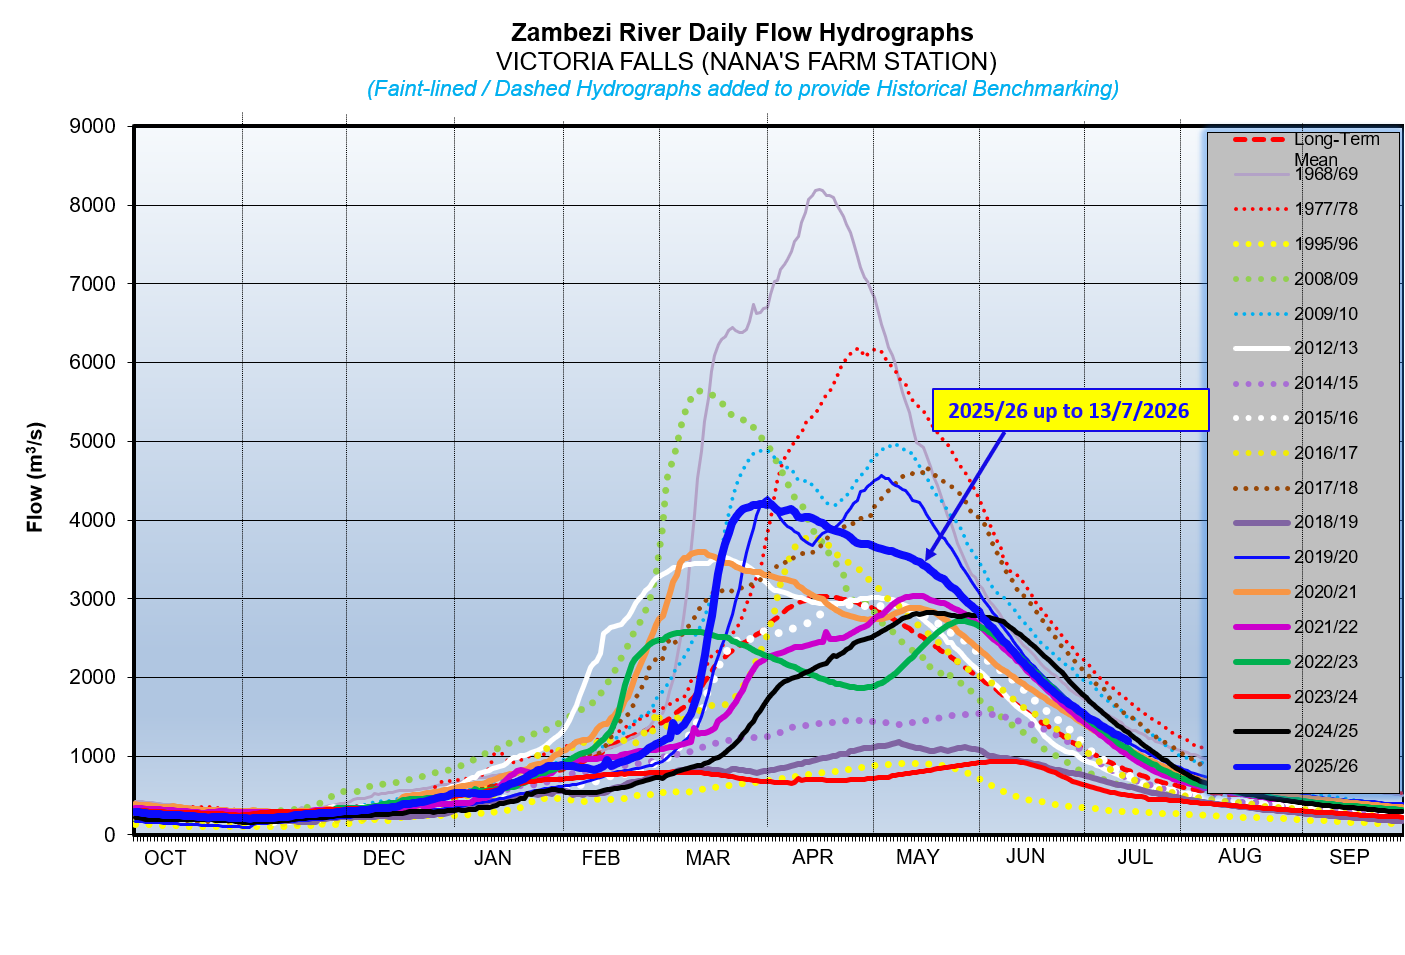
Flows at Victoria Falls decreased during the week under review before closing at 524m3/s on 22nd July 2019. Last year on the same date, the flow was 1,215m3/s.

Date Flow(m3/s)
16/07/2019585
17/07/2019573
18/07/2019560
19/07/2019548
20/07/2019536
21/07/2019530
22/07/2019524
From: 
Tuesday, July 16, 2019
To: 
Monday, July 22, 2019
Lake Levels Graphic: 

Chavuma

The Zambezi River flows at Chavuma are increasing again steadily as the rainfall season progresses, closing the period under review at 2,969m3/s as of 6th March 2026, whilst last year on the same date it was lower at 2,085m3/s.

From:
21 February 2026
To:
6 March 2026
DateFlow (m3/s)(2024/25)Flow (m3/s)(2023/24)
21-Feb2,6181,673
22-Feb2,6191,661
23-Feb2,6191,673
24-Feb2,6511,740
25-Feb2,7181,821
26-Feb2,7861,906
27-Feb2,8211,964
28-Feb2,8441,964
1-Mar2,8791,982
2-Mar2,8602,009
3-Mar2,8102,039
4-Mar2,8252,062
5-Mar2,9182,078
6-Mar2,9692,085

Ngonye

Flows at Ngonye are increasing, closing the period under review at 3,289m3/s as of 6th March 2026. The flow recorded last year on the same date was lower at 973m3/s.


From:
21 February 2026
To:
6 March 2026
DateFlow (m3/s)(2024/25)Flow (m3/s)(2023/24)
21-Feb1,126713
22-Feb1,151740
23-Feb1,196752
24-Feb1,243766
25-Feb1,311780
26-Feb1,390812
27-Feb1,481813
28-Feb1,628841
1-Mar1,791860
2-Mar1,991877
3-Mar2,232890
4-Mar2,536926
5-Mar2,871946
6-Mar3,289973

Victoria Falls (Nana’s Farm Station)

The Zambezi River flows at Victoria Falls – Nana’s Farm Station are increasing again as rainfall season progresses, closing the period under review at 1,357m3/s as of 6th March 2026.  The flow observed on the same date last year was lower at 822m3/s.

From:
21 February 2026
To:
6 March 2026
DateFlow (m3/s)(2024/25)Flow (m3/s)(2023/24)
21-Feb971624
22-Feb988650
23-Feb1,006664
24-Feb1,030680
25-Feb1,065692
26-Feb1,102705
27-Feb1,124719
28-Feb1,159727
1-Mar1,188721
2-Mar1,216752
3-Mar1,228769
4-Mar1,421787
5-Mar1,323805
6-Mar1,357822