Hydrology Banner

Victoria Falls / Big Tree

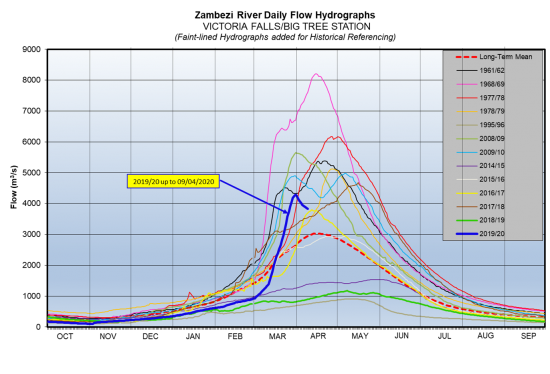
Flows at Victoria Falls have continued to increase steadily, peaking at 4,289m3/s on 31st March 2020 before dropping to 3,825m3/s on 9th April 2020. Last year on the same date, the flow was 896m3/s. The Zambezi River flows at all stations including the Victoria Falls are well above the long-term mean. A second peak is expected at this station.

DateFlow (m3/s) 2020Flow (m3/s) 2019
27/3/20203890800
28/3/20204053793
29/3/20204187800
30/3/20204255808
31/3/20204289816
1/4/20204255824
2/4/20204153831
3/4/20204086839
4/4/20204020847
5/4/20203954855
6/4/20203922863
7/4/20203890871
8/4/20203857888
9/4/20203825896
From: 
Friday, March 27, 2020
To: 
Thursday, April 9, 2020
Lake Levels Graphic: 
vic falls

Chavuma

The Zambezi River flows at Chavuma are rising steadily, with records of fluctuations being observed due to the influence of local rainfall activity, closing the period under review at 78m3/s as of 10th November 2025, whilst last year on the same date it was lower at 64m3/s.

From:
28 October 2025
To:
10 November 2025
DateFlow (m3/s)(2024/25)Flow (m3/s)(2023/24)
28-Oct6652
29-Oct6853
30-Oct6853
31-Oct6854
1-Nov6957
2-Nov7159
3-Nov7059
4-Nov7061
5-Nov6962
6-Nov7461
7-Nov7363
8-Nov7463
9-Nov7565
10-Nov7864

Ngonye

Flows at Ngonye are increasing with records of fluctuation being observed due to local rainfall activity, closing the period under review at 224m3/s as of 10th November 2025. The flow recorded last year on the same date was lower at 186m3/s.

From:
28 October 2025
To:
10 November 2025
DateFlow (m3/s)(2024/25)Flow (m3/s)(2023/24)
28-Oct6652
29-Oct6853
30-Oct6853
31-Oct6854
1-Nov6957
2-Nov7159
3-Nov7059
4-Nov7061
5-Nov6962
6-Nov7461
7-Nov7363
8-Nov7463
9-Nov7565
10-Nov7864

Victoria Falls (Nana’s Farm Station)

The Zambezi River flows at Victoria Falls – Nana’s Farm Station are in recession, with isolated rises being observed due to local rainfall activity, closing the period under review at 219m3/s as of 10th November 2025.  The flow observed on the same date last year was lower at 171m3/s.

From:
28 October 2025
To:
10 November 2025
DateFlow (m3/s)(2024/25)Flow (m3/s)(2023/24)
28-Oct220180
29-Oct219178
30-Oct214174
31-Oct212169
1-Nov212163
2-Nov211162
3-Nov206162
4-Nov212164
5-Nov217166
6-Nov220167
7-Nov216168
8-Nov216170
9-Nov217172
10-Nov219171