Hydrology Banner

Victoria Falls (Nana’s Farm Station)

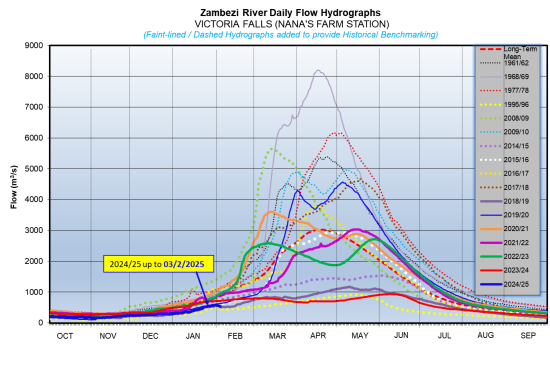
The Zambezi River flows at Victoria Falls that were steadily increasing have recorded reduction in flows due to reduced rainfall activities being observed around the catchment of interest, closing the period under review at 535m3/s on 3rd February 2025.  The flow observed on the same date last year was higher at 717m3/s.

DateFlow (m3/s)(2024/25)Flow (m3/s)(2023/24)
21-Jan466671
22-Jan527677
23-Jan517681
24-Jan538682
25-Jan547687
26-Jan547695
27-Jan548698
28-Jan566703
29-Jan574705
30-Jan576710
31-Jan570710
1-Feb559710
2-Feb546713
3-Feb535717
From: 
Tuesday, January 21, 2025
To: 
Monday, February 3, 2025
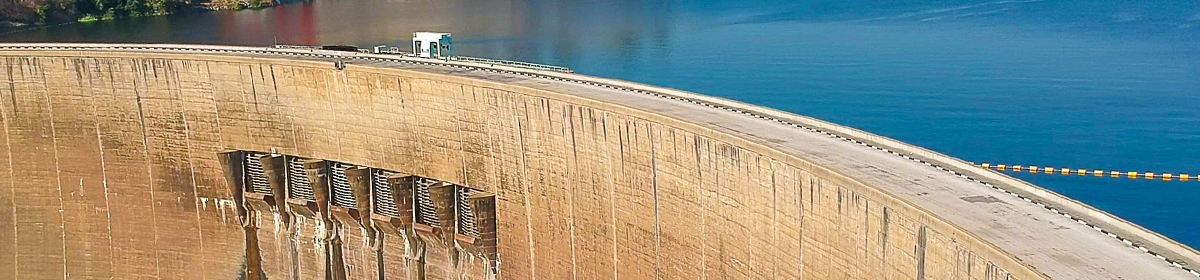
Lake Levels Graphic: 
vic-falls

Chavuma

The Zambezi River flows at Chavuma have been fluctuating because of variation in rainfall activity around the catchment of interest, closing the period under review at 2,088m3/s on 10th March 2025 whilst last year on the same date it was much lower at 344m3/s.

From:
4 March 2025
To:
10 March 2025
DateFlow (m3/s)(2024/25)Flow (m3/s)(2023/24)
4-Mar2,062369
5-Mar2,078366
6-Mar2,085357
7-Mar2,076350
8-Mar2,086347
9-Mar2,089343
10-Mar2,088344
chavuma

Ngonye

Flows at Ngonye are increasing steadily due to rainfall activity on the catchment, closing the period under review at 1,122m3/s as of 10th March 2025. The flow recorded last year on the same date was lower at 859m3/s.

From:
4 March 2025
To:
10 March 2025
DateFlow (m3/s)(2024/25)Flow (m3/s)(2023/24)
4-Mar926878
5-Mar946878
6-Mar973877
7-Mar1,007875
8-Mar1,023867
9-Mar1,083865
10-Mar1,122859
ngonye

Victoria Falls (Nana’s Farm Station)

The Zambezi River flows at Victoria Falls – Nana’s Farm Station are increasing steadily, closing the period under review at 871m3/s on 10th March 2025.  The flow observed on the same date last year was lower at 793m3/s.

From:
4 March 2025
To:
10 March 2025
DateFlow (m3/s)(2024/25)Flow (m3/s)(2023/24)
4-Mar787800
5-Mar805796
6-Mar822794
7-Mar836796
8-Mar845794
9-Mar856793
10-Mar871793
vic-falls