Hydrology Banner

Victoria Falls (Nana's Farm Station)

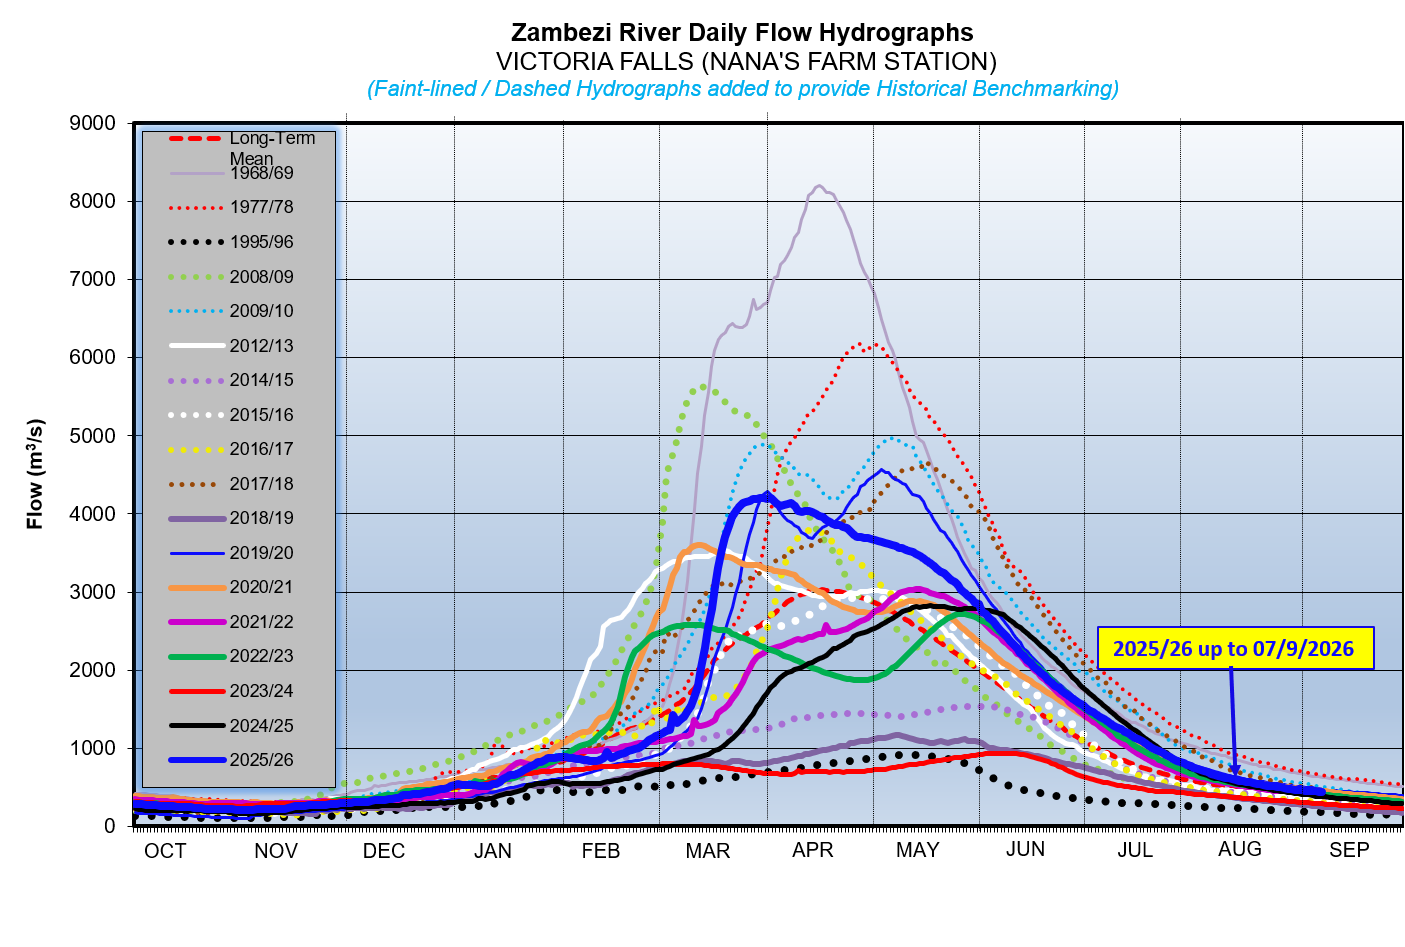
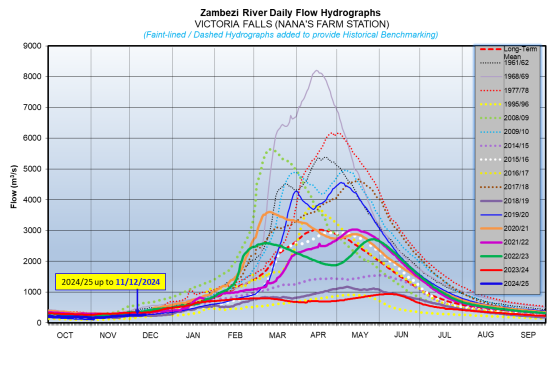
The Zambezi River flows at Nana’s Farm, located some 33km upstream of Victoria Falls (typically the same reach) have steadily been rising due to rainfall activity on the catchment as well as upstream recharge, closing the period under review at 260m3/s on 11th December 2024. The flow recorded on the same date last year was slightly higher at 335m3/s.

NB: As there is no significant increase in runoff between this station and the Big Tree Station 33km downstream and given that Nana’s Farm Station presents superior hydrometric conditions, the two stations have since been merged into one and code-named: “Zambezi River at Victoria Falls (Nana’s Farm Station)”.

DateFlow (m3/s)(2023/24)Flow (m3/s)(2022/23)
26-Nov237318
27-Nov238321
28-Nov242321
29-Nov248325
30-Nov247326
1-Dec244330
2-Dec244330
3-Dec243330
4-Dec244335
5-Dec245336
6-Dec248335
7-Dec250330
8-Dec251328
9-Dec254329
From: 
Tuesday, November 26, 2024
To: 
Wednesday, December 11, 2024
Lake Levels Graphic: 
vic-falls

Chavuma

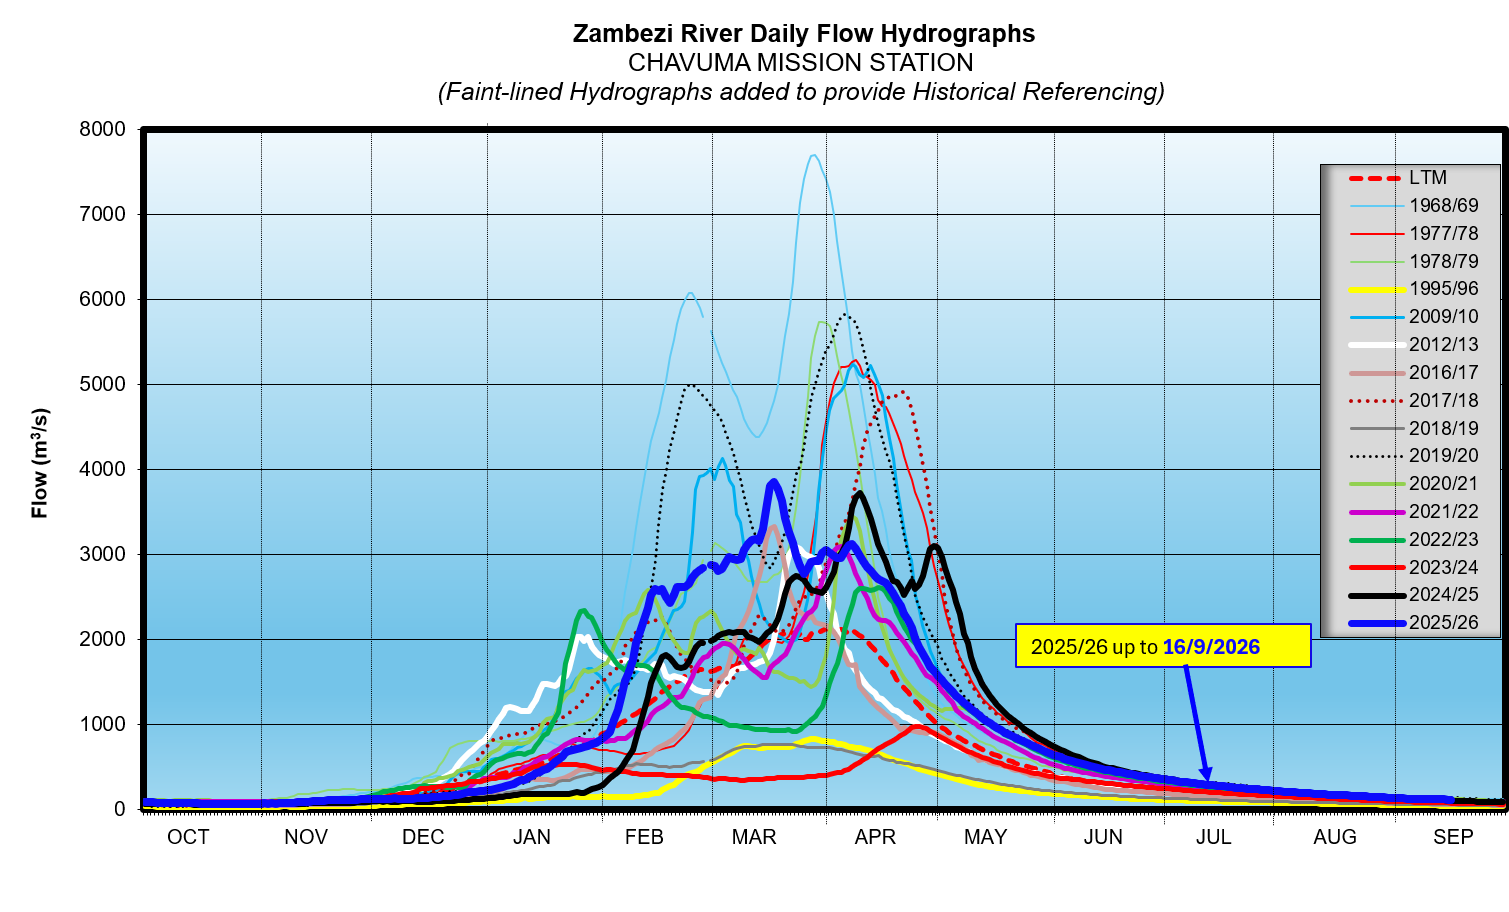
The Zambezi River flows at Chavuma are in recession, closing the period under review at 289m3/s as of 13th July 2026, whilst last year on the same date it was at 291m3/s.

From:
30 June 2026
To:
13 July 2026
DateFlow (m3/s)(2025/26)Flow (m3/s)(2024/25)
30-Jun362371
1-Jul356366
2-Jul348360
3-Jul341354
4-Jul334343
5-Jul329337
6-Jul324331
7-Jul321326
8-Jul316321
9-Jul309313
10-Jul303309
11-Jul297304
12-Jul293297
13-Jul289291

Ngonye

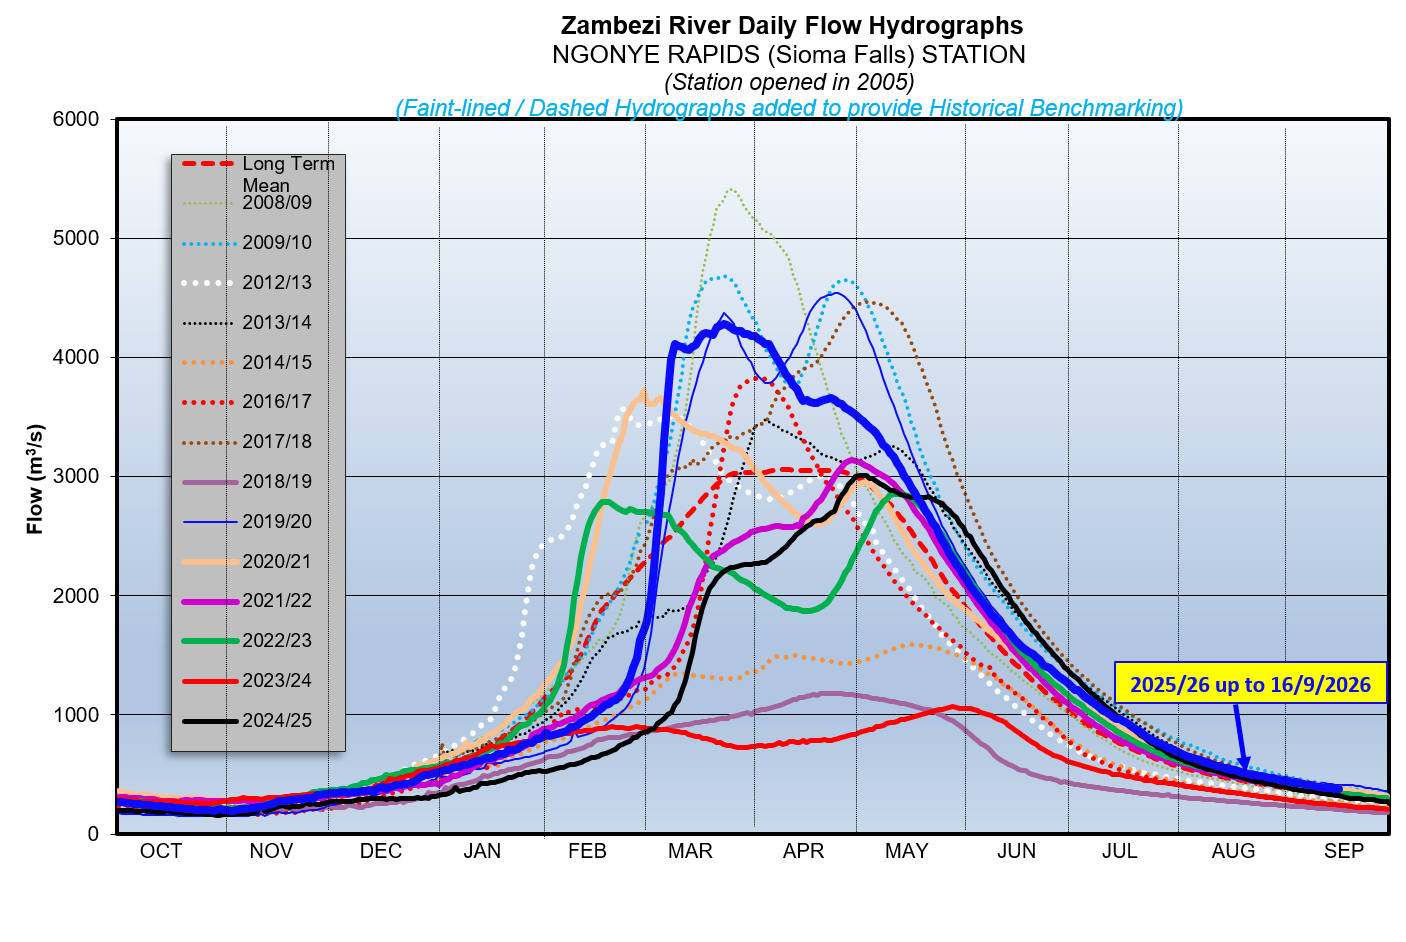
Flows at Ngonye are steadily decreasing, closing the period under review at 983m3/s as of 13th July 2026. The flow recorded last year on the same date was at 1,028m3/s.

From:
30 June 2026
To:
13 July 2026
DateFlow (m3/s)(2025/26)Flow (m3/s)(2024/25)
30-Jun1,2651,379
1-Jul1,2391,336
2-Jul1,2121,321
3-Jul1,2061,295
4-Jul1,1761,267
5-Jul1,1511,239
6-Jul1,1351,208
7-Jul11061177
8-Jul10921152
9-Jul10641129
10-Jul10451099
11-Jul10261075
12-Jul10051047
13-Jul9831028

Victoria Falls (Nana’s Farm Station)

The Zambezi River flows at Victoria Falls – Nana’s Farm Station are steadily decreasing, closing the period under review at 1,188m3/s as of 13th July 2026.  The flow observed on the same date last year was at 1,296m3/s.

From:
30 June 2026
To:
13 July 2026
DateFlow (m3/s)(2025/26)Flow (m3/s)(2024/25)
30-Jun1,5491,780
1-Jul1,5151,744
2-Jul1,4771,700
3-Jul1,4641,663
4-Jul1,4311,624
5-Jul1,4011,582
6-Jul1,3741,545
7-Jul1,3461,506
8-Jul1,3161,468
9-Jul1,2851,429
10-Jul1,2641,396
11-Jul1,2411,361
12-Jul1,2131,332
13-Jul1,1881,296