Hydrology Banner

Victoria Falls (Nana's Farm Station)

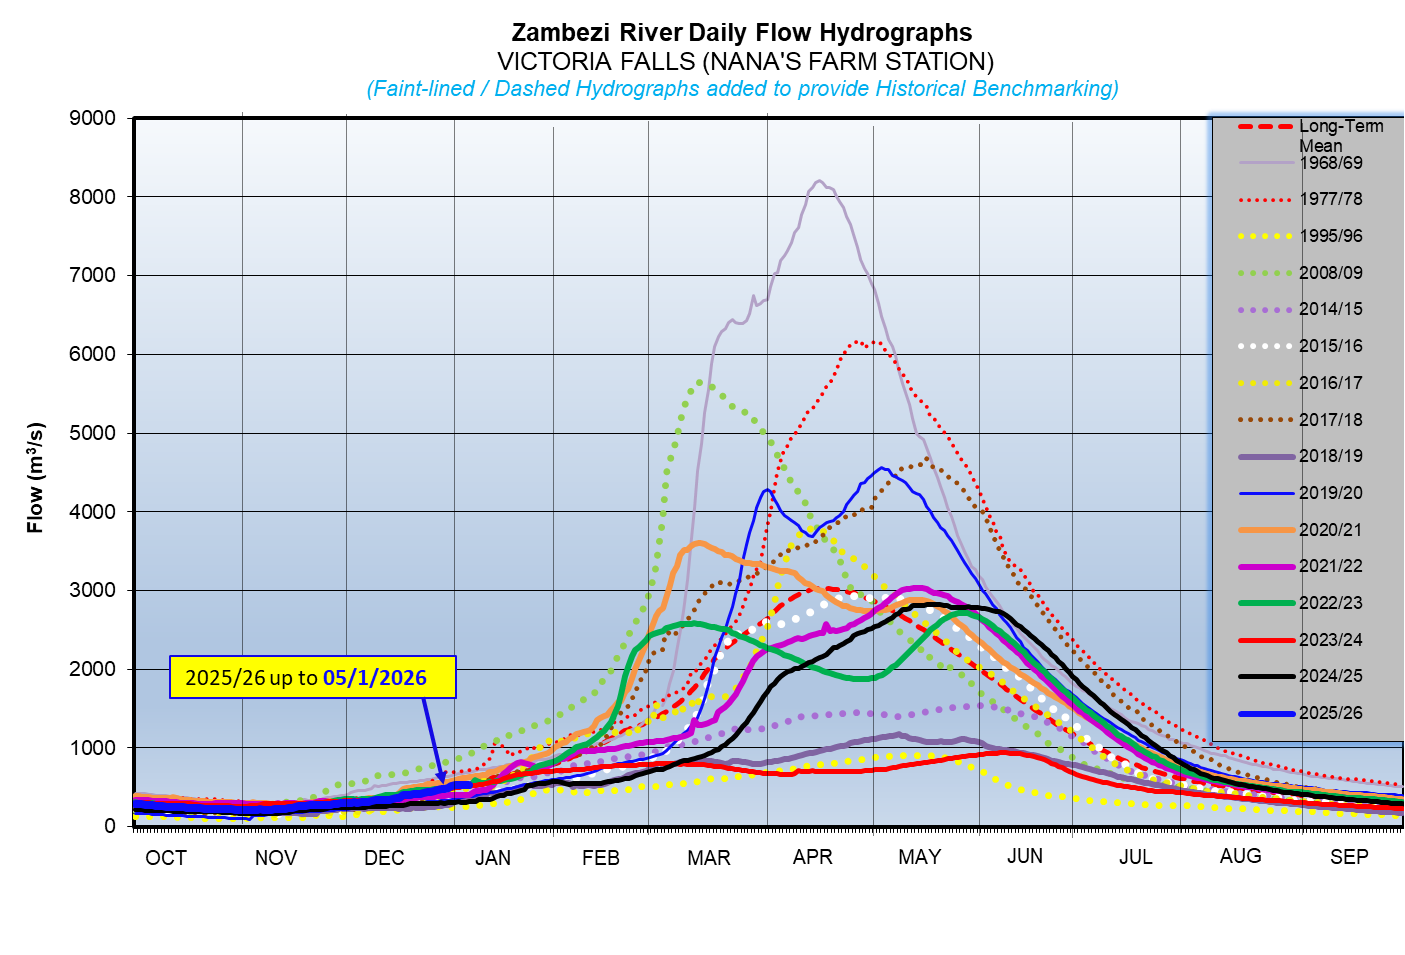
The Zambezi River flows at Victoria Falls – Nana’s Farm Station are steadily rising, closing the period under review at 658m3/s as of 18th January 2026.  The flow observed on the same date last year was lower at 431m3/s.

DateFlow (m3/s)(2024/25)Flow (m3/s)(2023/24)
5-Jan525320
6-Jan529321
7-Jan527325
8-Jan521351
9-Jan517351
10-Jan517347
11-Jan519349
12-Jan535356
13-Jan542378
14-Jan563397
15Jan605401
16-Jan627415
17-Jan651420
18-Jan658431
From: 
Monday, January 5, 2026
To: 
Sunday, January 18, 2026
Lake Levels Graphic: 

Chavuma

The Zambezi River flows at Chavuma are rising steadily as the rainfall season progresses, closing the period under review at 723m3/s as of 26th January 2026, whilst last year on the same date it was lower at 197m3/s.

From:
13 January 2026
To:
26 January 2026
DateFlow (m3/s)(2024/25)Flow (m3/s)(2023/24)
13-Jan399180
14-Jan428182
15-Jan443183
16-Jan465182
17-Jan475181
18-Jan511181
19-Jan557183
20-Jan585186
21-Jan613186
22-Jan677184
23-Jan688186
24-Jan704192
25-Jan713210
26-Jan723197

Ngonye

Flows at Ngonye are increasing with records of fluctuation being observed due to the influence of local rainfall activity, closing the period under review at 754m3/s as of 26th January 2026. The flow recorded last year on the same date was lower at 516m3/s.

From:
13 January 2026
To:
26 January 2026
DateFlow (m3/s)(2024/25)Flow (m3/s)(2023/24)
13-Jan616421
14-Jan626422
15-Jan638425
16-Jan641431
17-Jan650436
18-Jan668444
19-Jan674450
20-Jan675457
21-Jan706471
22-Jan703472
23-Jan707483
24-Jan716500
25-Jan749502
26-Jan754516

Victoria Falls (Nana’s Farm Station)

From:
13 January 2026
To:
26 January 2026
DateFlow (m3/s)(2024/25)Flow (m3/s)(2023/24)
13-Jan542378
14-Jan563397
15-Jan605401
16-Jan627415
17-Jan651420
18-Jan658431
19-Jan674441
20-Jan697458
21-Jan717466
22-Jan748527
23-Jan775517
24-Jan790538
25-Jan828547
26-Jan829547