Hydrology Banner

Victoria Falls (Nana's Farm Station)

DateFlow (m3/s)(2024/25)Flow (m3/s)(2023/24)
13-Jan542378
14-Jan563397
15-Jan605401
16-Jan627415
17-Jan651420
18-Jan658431
19-Jan674441
20-Jan697458
21-Jan717466
22-Jan748527
23-Jan775517
24-Jan790538
25-Jan828547
26-Jan829547
From: 
Tuesday, January 13, 2026
To: 
Monday, January 26, 2026
Lake Levels Graphic: 

Chavuma

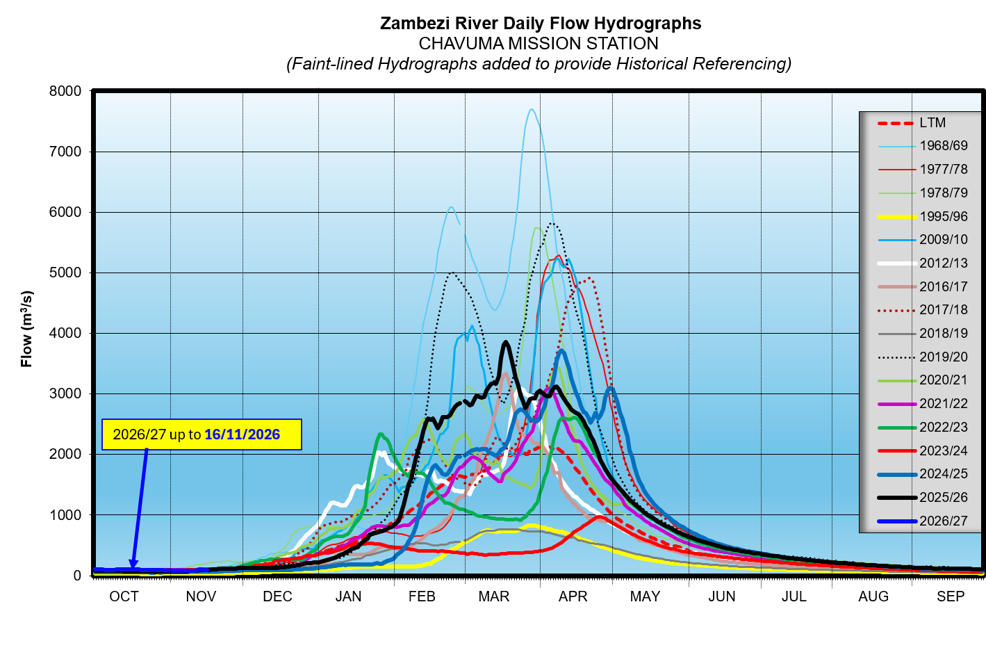
Zambezi River flows at Chavuma are steadily rising, with fluctuations caused by localised rainfall in the catchment. As of 16th November 2026, the flow stood at 98m3/s, compared with 97m3/s on the same date last year.

From:
3 November 2026
To:
16 November 2026
DateFlow (m3/s)(2025/26)Flow (m3/s)(2024/25)
3 -Nov8470
4 -Nov8270
5 -Nov8169
6 -Nov8174
7-Nov8173
8 -Nov8074
9 -Nov7975
10-Nov8178
11-Nov8682
12-Nov9284
13-Nov9887
14-Nov9892
15-Nov9694
16-Nov9897

Ngonye

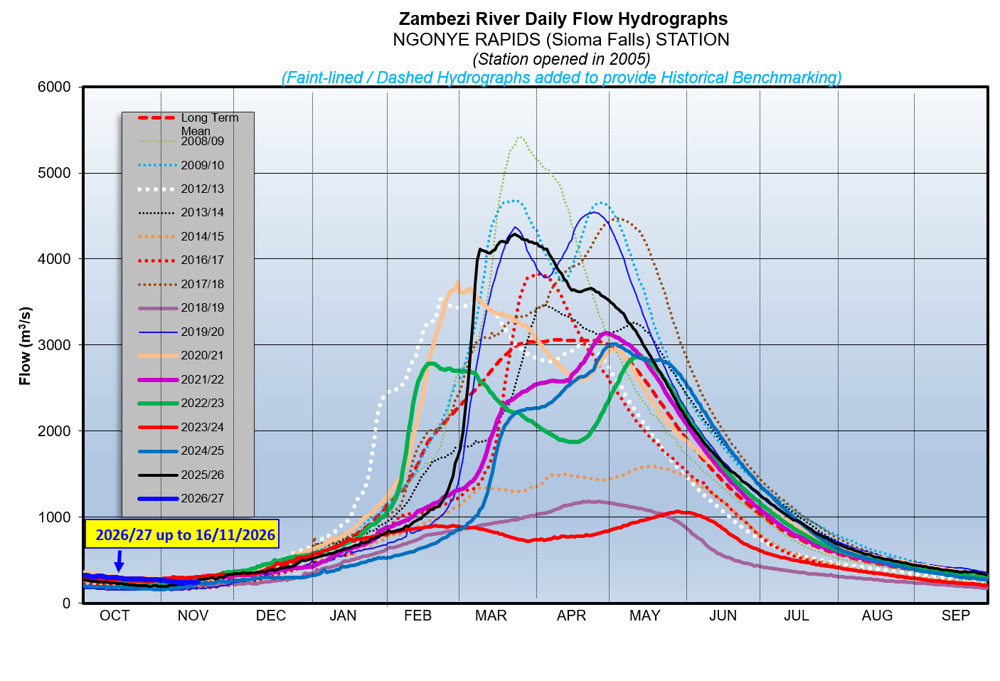
Flows at Ngonye are steadily declining, with occasional rises caused by rainfall. As of 16th November 2026, the flow stood at 247m3/s, compared with 274m3/s on the same date last year.

From:
3 November 2026
To:
16 November 2026
DateFlow (m3/s)(2025/26)Flow (m3/s)(2024/25)
3-Nov258195
4-Nov255202
5-Nov254211
6-Nov252209
7-Nov247213
8-Nov245220
9-Nov244219
10-Nov244224
11-Nov241226
12-Nov241238
13-Nov247241
14-Nov245253
15-Nov240257
16-Nov247274

Victoria Falls (Nana’s Farm Station)

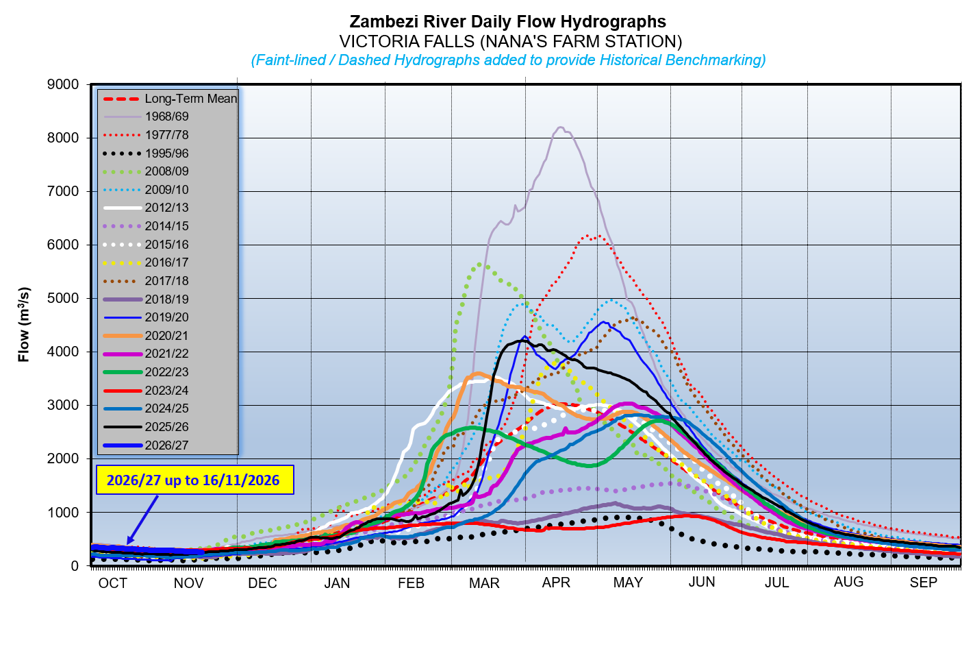
The Zambezi River flows at Victoria Falls – Nana’s Farm Station are steadily decreasing, closing the period under review at 258m3/s as of 16th November 2026.  The flow observed on the same date last year was at 254m3/s.

From:
3 November 2026
To:
16 November 2026
DateFlow (m3/s)(2025/26)Flow (m3/s)(2024/25)
3-Nov289206
4-Nov287212
5-Nov285217
6-Nov281220
7-Nov279216
8-Nov275216
9-Nov273217
10-Nov272219
11-Nov271226
12-Nov270226
13-Nov266225
14-Nov262231
15-Nov259240
16-Nov258254