Hydrology Banner

Victoria Falls (Nana's Farm Station)

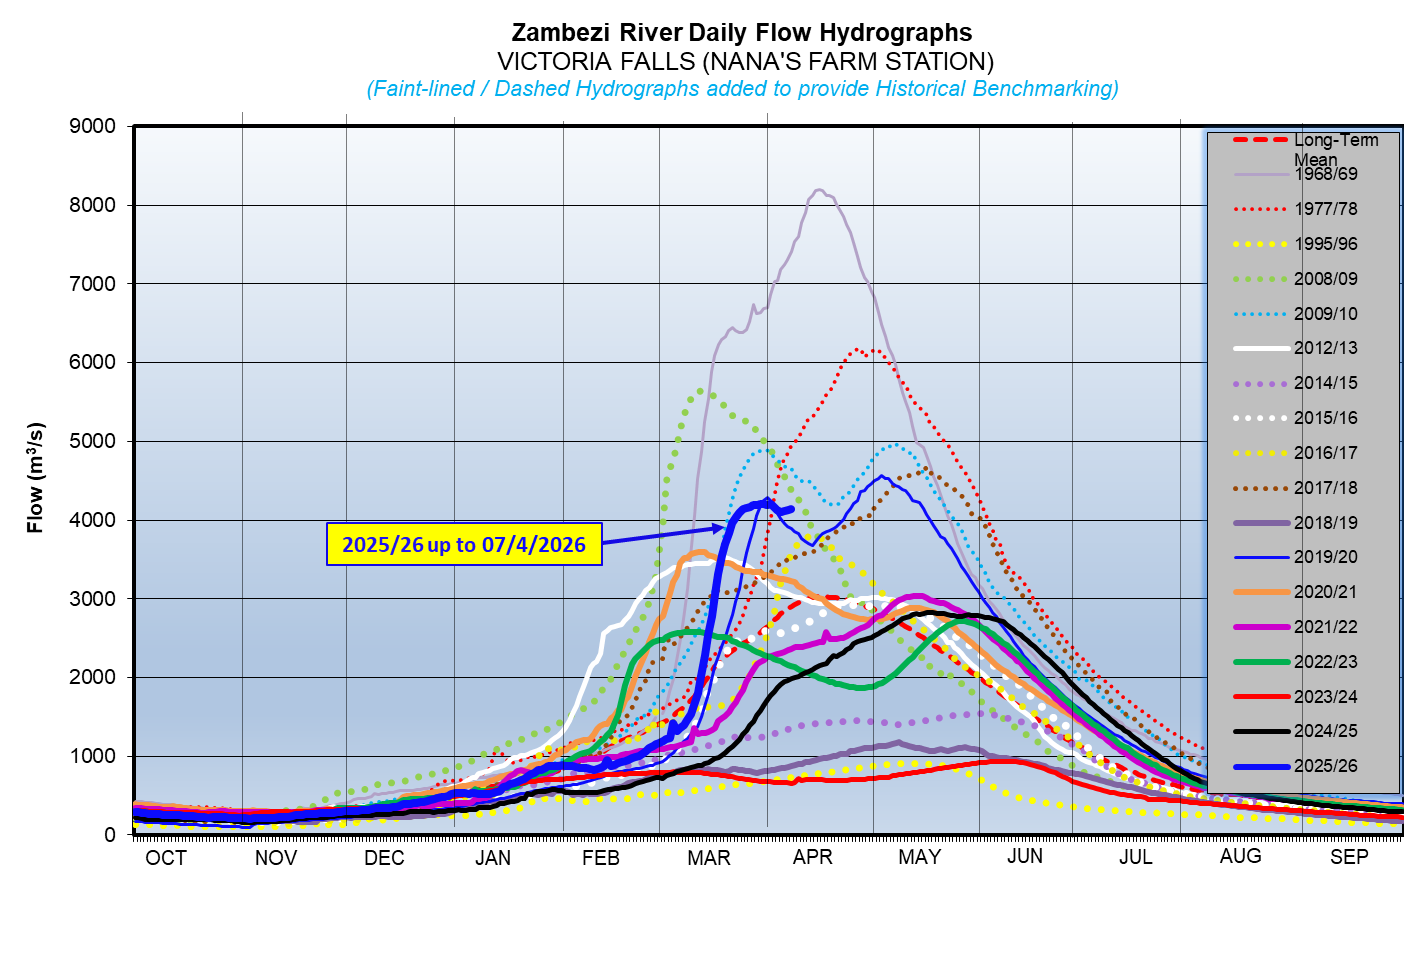
The Zambezi River flows at Victoria Falls – Nana’s Farm Station are increasing as rainfall season progresses, with fluctuations being observed in the flows, closing the period under review at 4,136m3/s as of 7th April 2026.  The flow observed on the same date last year was lower at 1,983m3/s.

DateFlow (m3/s)(2024/25)Flow (m3/s)(2023/24)
25-Mar4,1521,325
26-Mar4,1651,385
27-Mar4,1871,447
28-Mar4,1921,519
29-Mar4,2001,586
30-Mar4,2061,647
31-Mar4,1951,718
1-Apr4,2001,776
2-Apr4,1601,822
3-Apr4,1311,872
4-Apr4,1041,909
5-Apr4,1151,946
6-Apr4,1331,967
7-Apr4,1361,983
From: 
Wednesday, March 25, 2026
To: 
Tuesday, April 7, 2026
Lake Levels Graphic: 

Chavuma

The Zambezi River flows at Chavuma are steadily decreasing, closing the period under review at 1,830m3/s as of 27th April 2026, whilst last year on the same date it was at 2,749m3/s.

From:
14 April 2026
To:
27 April 2026
DateFlow (m3/s)(2025/26)Flow (m3/s)(2024/25)
14-Apr2,7443,259
15-Apr2,7103,127
16-Apr2,6903,019
17-Apr2,6672,916
18-Apr2,6172,803
19-Apr2,5522,692
20-Apr2,4692,682
21-Apr2,3992,601
22-Apr2,3052,523
23-Apr2,2252,610
24-Apr2,1332,684
25-Apr2,0202,597
26-Apr1,9062,641
27-Apr1,8302,749

Ngonye

Flows at Ngonye are steadily decreasing, with records of fluctuation being observed due to localised rainfall activity within the catchment area, closing the period under review at 3,580m3/s as of 27th April 2026. The flow recorded last year on the same date was lower at 2,885m3/s.

From:
14 April 2026
To:
27 April 2026
DateFlow (m3/s)(2025/26)Flow (m3/s)(2024/25)
14-Apr3,6792,529
15-Apr3,6402,557
16-Apr3,6472,580
17-Apr3,6242,596
18-Apr3,6212,626
19-Apr3,6212,629
20-Apr3,6402,633
21-Apr3,6472,650
22-Apr3,6502,673
23-Apr3,6632,697
24-Apr3,6452,706
25-Apr3,6212,799
26-Apr3,6112,842
27-Apr3,5802,885

Victoria Falls (Nana’s Farm Station)

The Zambezi River flows at Victoria Falls – Nana’s Farm Station are steadily decreasing, closing the period under review at 3,700m3/s as of 27th April 2026.  The flow observed on the same date last year was lower at 2,467m3/s.

From:
14 April 2026
To:
27 April 2026
DateFlow (m3/s)(2025/26)Flow (m3/s)(2024/25)
14-Apr3,6792,529
15-Apr3,6402,557
16-Apr3,6472,580
17-Apr3,6242,596
18-Apr3,6212,626
19-Apr3,6212,629
20-Apr3,6402,633
21-Apr3,6472,650
22-Apr3,6502,673
23-Apr3,6632,697
24-Apr3,6452,706
25-Apr3,6212,799
26-Apr3,6112,842
27-Apr3,5802,885