Hydrology Banner

Victoria Falls/Big Tree

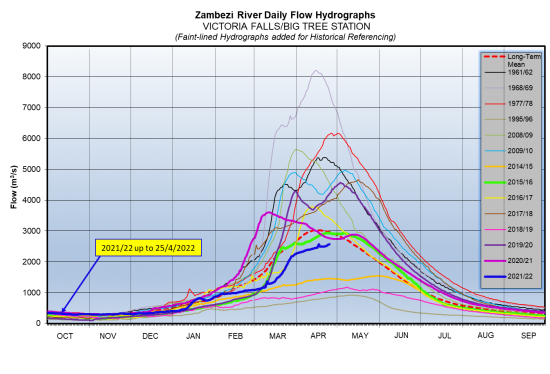
The Zambezi River flows at Victoria Falls have continued increasing, closing the period under review at 2,573m3/s on 25th April 2022. The flow observed on the same date last year was 2,766m3/s.

DateFlow (m3/s)(2021/22)Flow (m3/s)(2020/21)
4/12/20222,4183,077
4/13/20222,4293,053
4/14/20222,4453,024
4/15/20222,4562,996
4/16/20222,4562,972
4/17/20222,5732,945
4/18/20222,4892,903
4/19/20222,4942,877
4/20/20222,4892,858
4/21/20222,4962,834
4/22/20222,5072,808
4/23/20222,5212,797
4/24/20222,5552,783
4/25/20222,5732,766
From: 
Tuesday, April 12, 2022
To: 
Monday, April 25, 2022
Lake Levels Graphic: 
vic falls

Chavuma

The Zambezi River flows at Chavuma are decreasing after peaking to 3,851m3/s as at 18th March 2026, before dropping to 3,136m3/s at the close of the period under review of 23rd March 2026, whilst last year on the same date it was lower at 2,722m3/s.

From:
10 March 2026
To:
23 March 2026
DateFlow (m3/s)(2025/26)Flow (m3/s)(2024/25)
10-Mar3,0582,088
11-Mar3,1222,026
12-Mar3,1702,018
13-Mar3,1801,998
14-Mar3,1641,972
15-Mar3,2982,023
16-Mar3,5922,073
17-Mar3,8052,101
18-Mar3,8512,148
19-Mar3,7732,244
20-Mar3,6262,390
21-Mar3,4322,538
22-Mar3,2712,677
23-Mar3,1362,722

Ngonye

Flows at Ngonye are increasing, closing the period under review at 4,286m3/s as of 23rd March 2026. The flow recorded last year on the same date was lower at 2,201m3/s.

From:
10 March 2026
To:
23 March 2026
DateFlow (m3/s)(2025/26)Flow (m3/s)(2024/25)
10-Mar4,1011,122
11-Mar4,0871,194
12-Mar4,0711,285
13-Mar4,0631,400
14-Mar4,0871,522
15-Mar4,1091,665
16-Mar4,1601,804
17-Mar4,1961,902
18-Mar4,2071,995
19-Mar4,1992,062
20-Mar4,1902,101
21-Mar4,2532,142
22-Mar4,2702,179
23-Mar4,2862,201

Victoria Falls (Nana’s Farm Station)

The Zambezi River flows at Victoria Falls – Nana’s Farm Station are increasing as rainfall season progresses, closing the period under review at 4,090m3/s as of 23rd March 2026.  The flow observed on the same date last year was lower at 1,216m3/s.

From:
10 March 2026
To:
23 March 2026
DateFlow (m3/s)(2025/26)Flow (m3/s)(2024/25)
10-Mar1,645871
11-Mar1,800879
12-Mar2,023888
13-Mar2,281903
14-Mar2,544925
15-Mar2,787942
16-Mar3,061965
17-Mar3,313984
18-Mar3,5561,012
19-Mar3,7021,049
20-Mar3,8401,080
21-Mar3,9661,123
22-Mar4,0351,160
23-Mar4,0901,216