Hydrology Banner

Victoria Falls / Big Tree

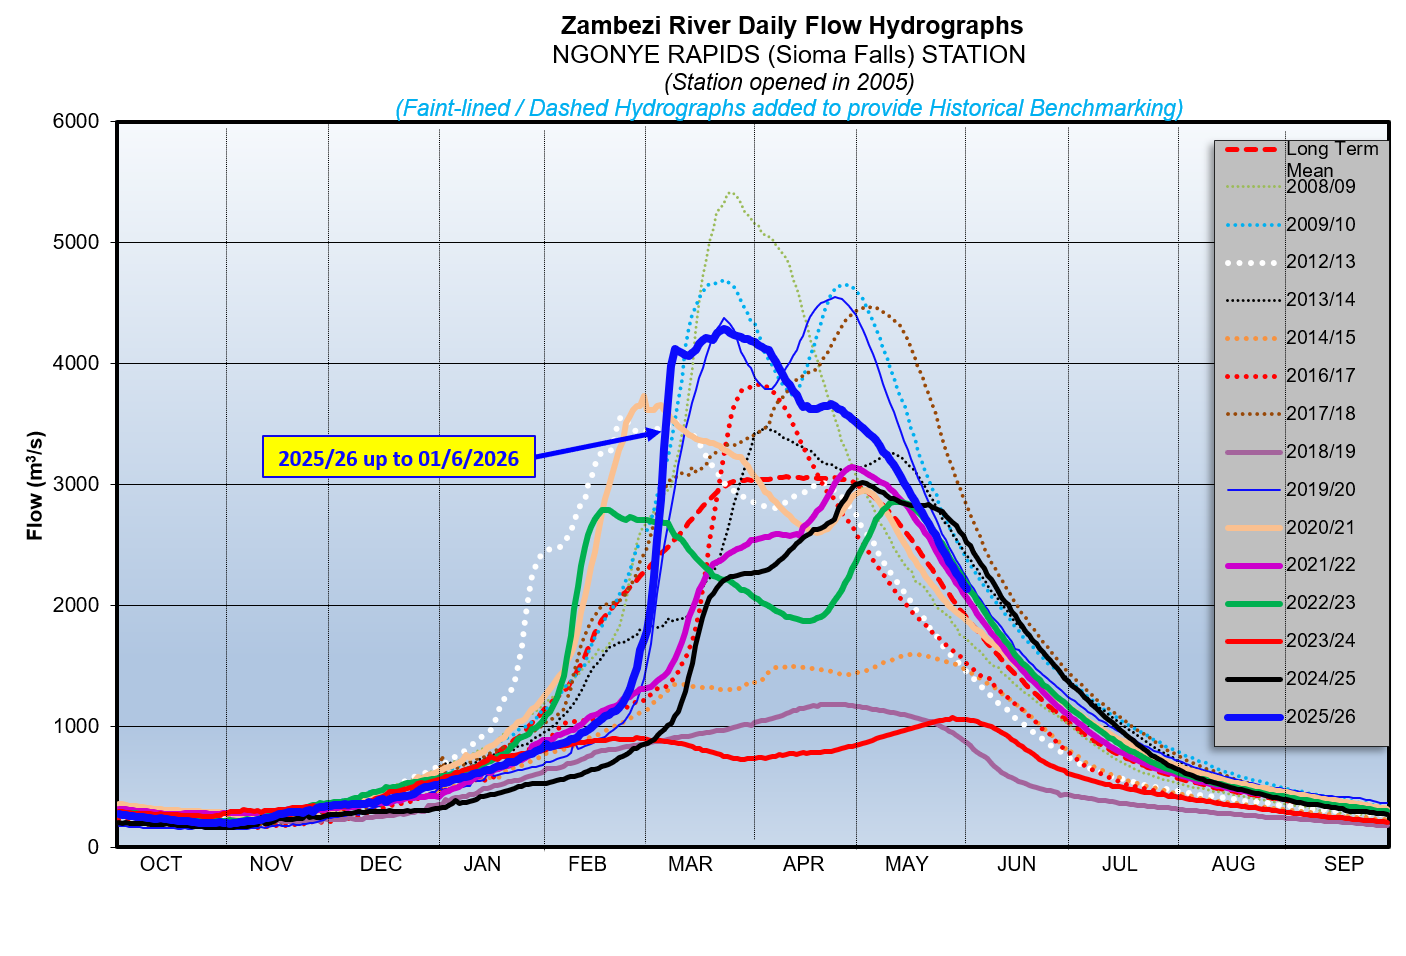
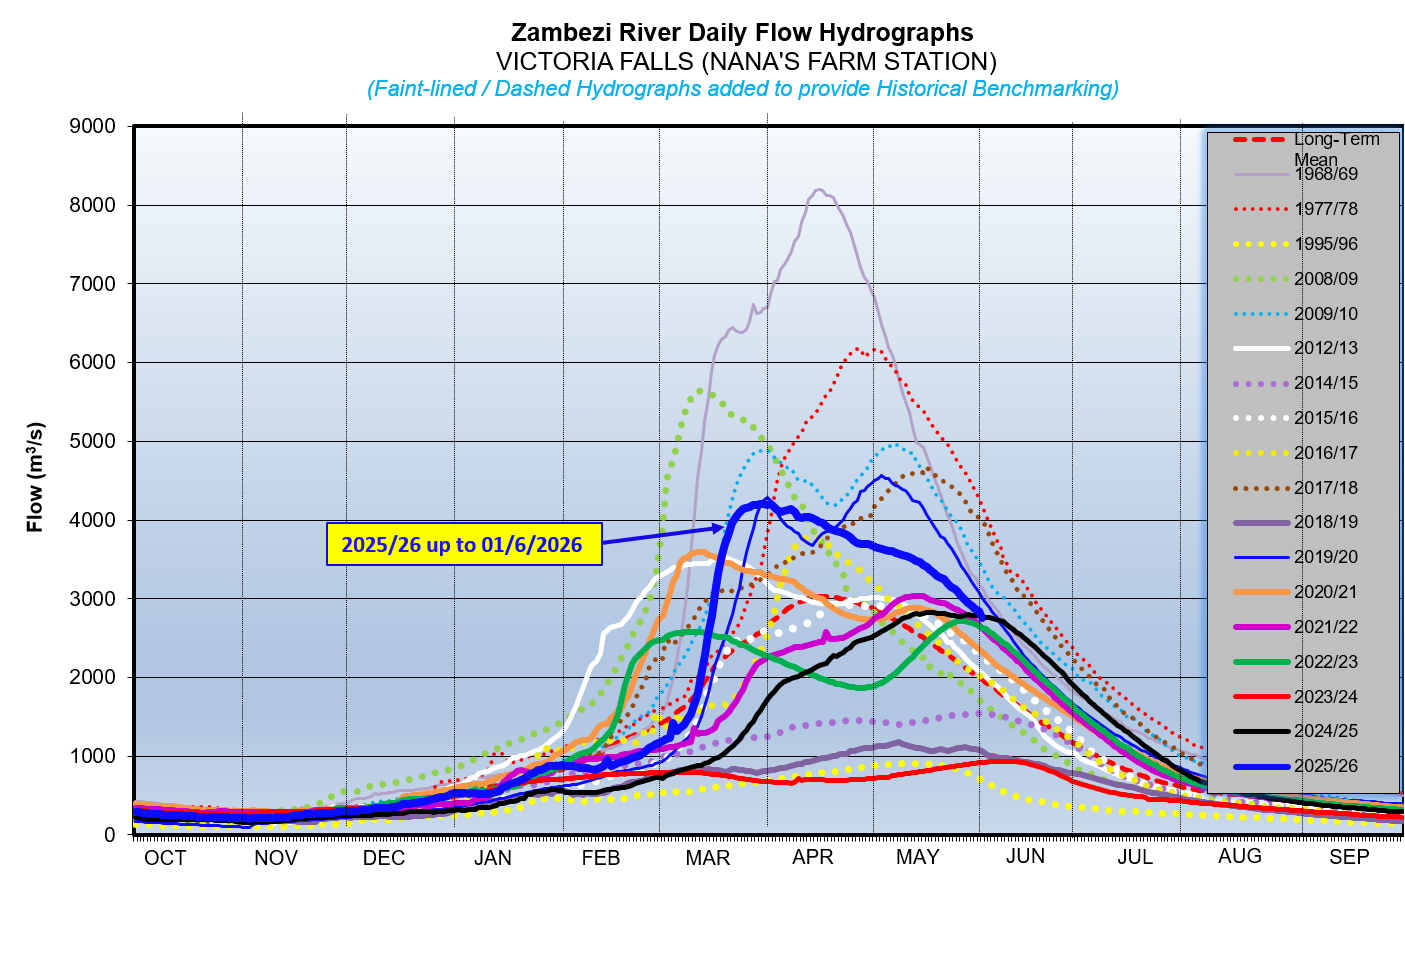
Flows at Victoria Falls have been decreasing closing the week under review at 386m3/s on 24th September 2018. Last year on the same date, the flow was 231m3/s.  

Date Flow(m3/s)
18/09/2018401
19/09/2018396
20/09/2018396
21/09/2018391
22/09/2018391
23/09/2018386
24/09/2018386
From: 
Tuesday, September 18, 2018
To: 
Monday, September 24, 2018
Lake Levels Graphic: 
Victoria Falls / Big Tree

Chavuma

The Zambezi River flows at Chavuma are rising steadily, with records of fluctuations being observed due to the influence of local rainfall activity, closing the period under review at 78m3/s as of 10th November 2025, whilst last year on the same date it was lower at 64m3/s.

From:
28 October 2025
To:
10 November 2025
DateFlow (m3/s)(2024/25)Flow (m3/s)(2023/24)
28-Oct6652
29-Oct6853
30-Oct6853
31-Oct6854
1-Nov6957
2-Nov7159
3-Nov7059
4-Nov7061
5-Nov6962
6-Nov7461
7-Nov7363
8-Nov7463
9-Nov7565
10-Nov7864

Ngonye

Flows at Ngonye are increasing with records of fluctuation being observed due to local rainfall activity, closing the period under review at 224m3/s as of 10th November 2025. The flow recorded last year on the same date was lower at 186m3/s.

From:
28 October 2025
To:
10 November 2025
DateFlow (m3/s)(2024/25)Flow (m3/s)(2023/24)
28-Oct6652
29-Oct6853
30-Oct6853
31-Oct6854
1-Nov6957
2-Nov7159
3-Nov7059
4-Nov7061
5-Nov6962
6-Nov7461
7-Nov7363
8-Nov7463
9-Nov7565
10-Nov7864

Victoria Falls (Nana’s Farm Station)

The Zambezi River flows at Victoria Falls – Nana’s Farm Station are in recession, with isolated rises being observed due to local rainfall activity, closing the period under review at 219m3/s as of 10th November 2025.  The flow observed on the same date last year was lower at 171m3/s.

From:
28 October 2025
To:
10 November 2025
DateFlow (m3/s)(2024/25)Flow (m3/s)(2023/24)
28-Oct220180
29-Oct219178
30-Oct214174
31-Oct212169
1-Nov212163
2-Nov211162
3-Nov206162
4-Nov212164
5-Nov217166
6-Nov220167
7-Nov216168
8-Nov216170
9-Nov217172
10-Nov219171