Hydrology Banner

Victoria Falls

The Zambezi River flows at Victoria Falls are decreasing, closing the period under review at 2,227m3/s on 3rd April 2023. The flow observed on the same date last year was 2,297m3/s.

DateFlow (m3/s)(2022/23)Flow (m3/s)(2021/22)
21 March2,4651,624
22 March2,4471,69
23 March2,4251,764
24 March2,4071,846
25 March2,3961,94
26 March2,3762,029
27 March2,3542,099
28 March2,332,173
29 March2,3122,195
30 March2,292,225
31 March2,2712,257
01 April2,2552,273
02 April2,242,288
03 April2,2272,297
From: 
Tuesday, March 21, 2023
To: 
Monday, April 3, 2023
Lake Levels Graphic: 

Chavuma

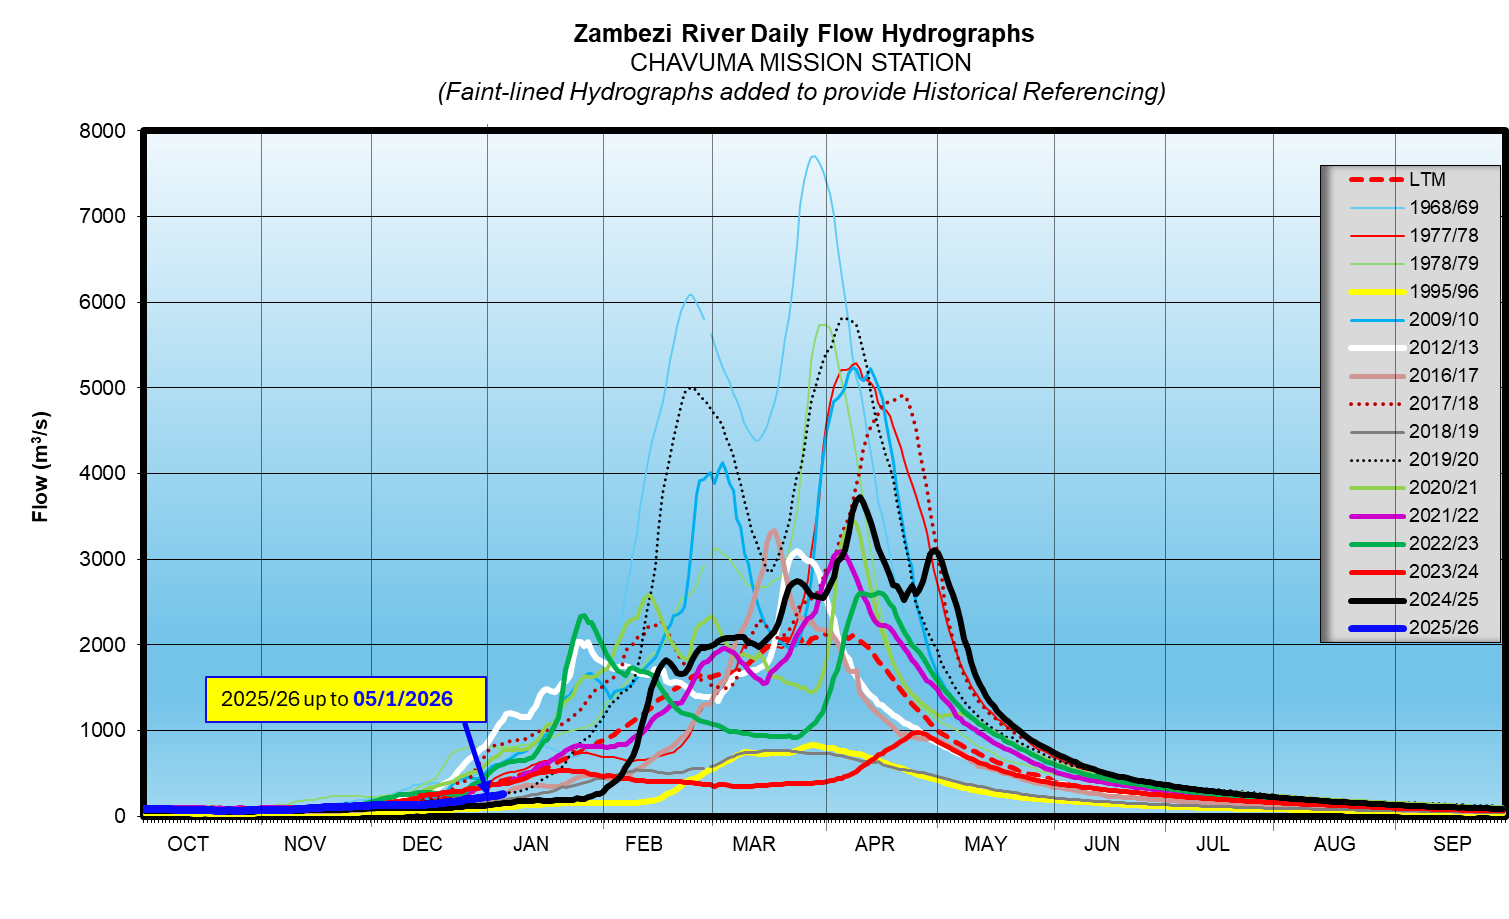
Though with a temporal dip on 19th February 2025, the Zambezi River flows at Chavuma have increased significantly in the second half of the month, closing the period under review at 1,729m3/s on 20th February 2025 whilst last year on the same date it was much lower at 404m3/s.

From:
14 February 2025
To:
20 February 2025
DateFlow (m3/s)(2024/25)Flow (m3/s)(2023/24)
14-Feb1488409
15-Feb1606409
16-Feb1713408
17-Feb1790407
18-Feb1821404
19-Feb1783401
20-Feb1729404
chavuma

Ngonye

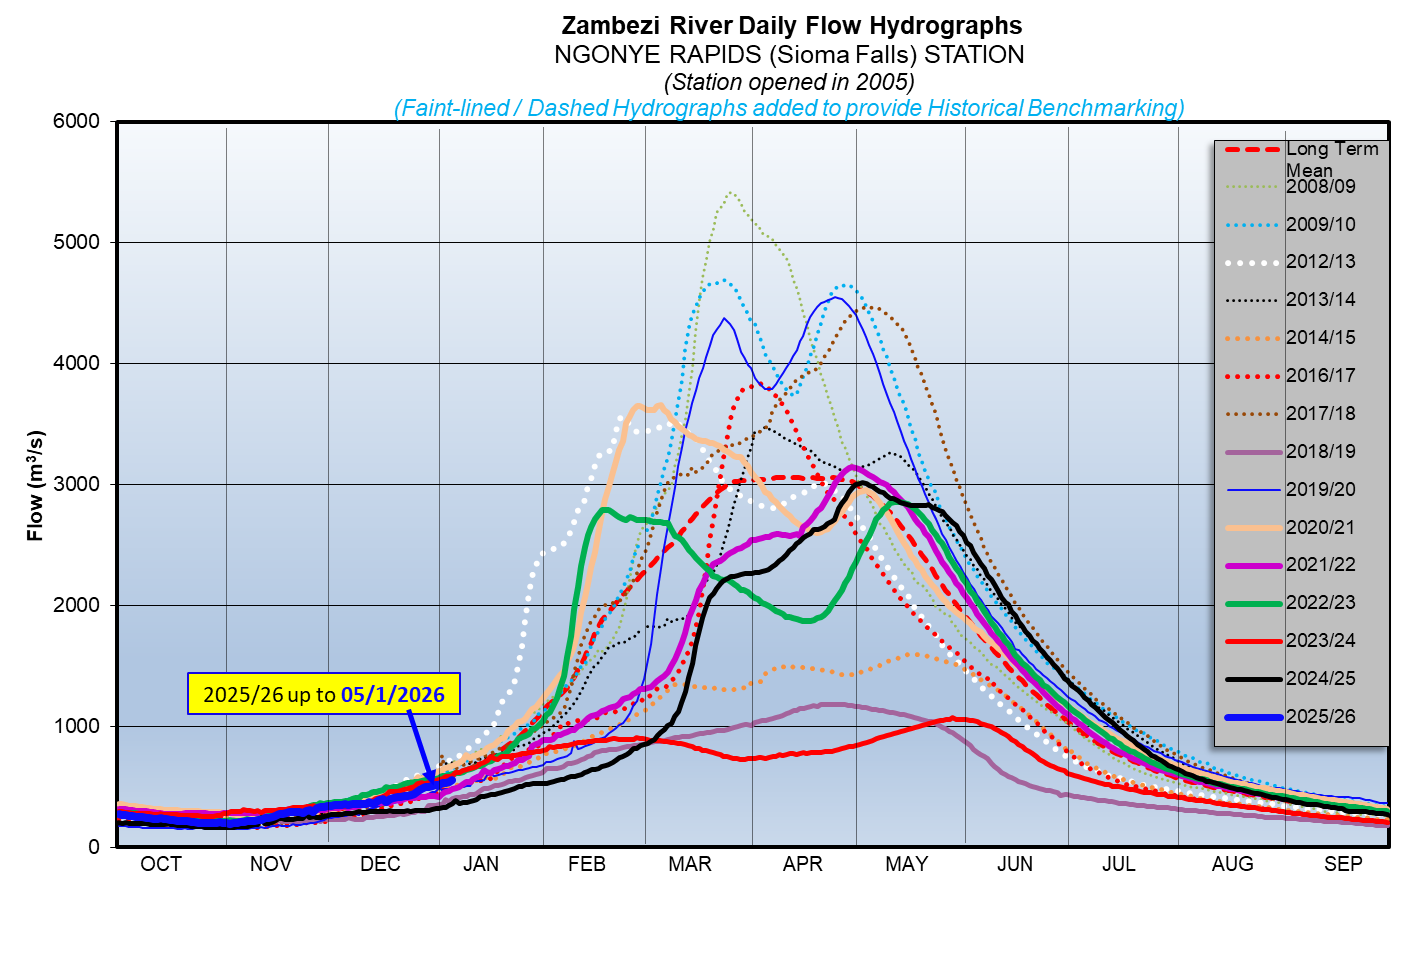
Flows at Ngonye are increasing steadily due to rainfall activity on the catchment, closing the period under review at 700m3/s as of 20th February 2025. The flow recorded last year on the same date was higher at 900m3/s.

From:
14 February 2025
To:
20 February 2025
DateFlow (m3/s)(2024/25)Flow (m3/s)(2023/24)
14-Feb640873
15-Feb644880
16-Feb653883
17-Feb665883
18-Feb677883
19-Feb685891
20-Feb700900
ngonye

Victoria Falls (Nana’s Farm Station)

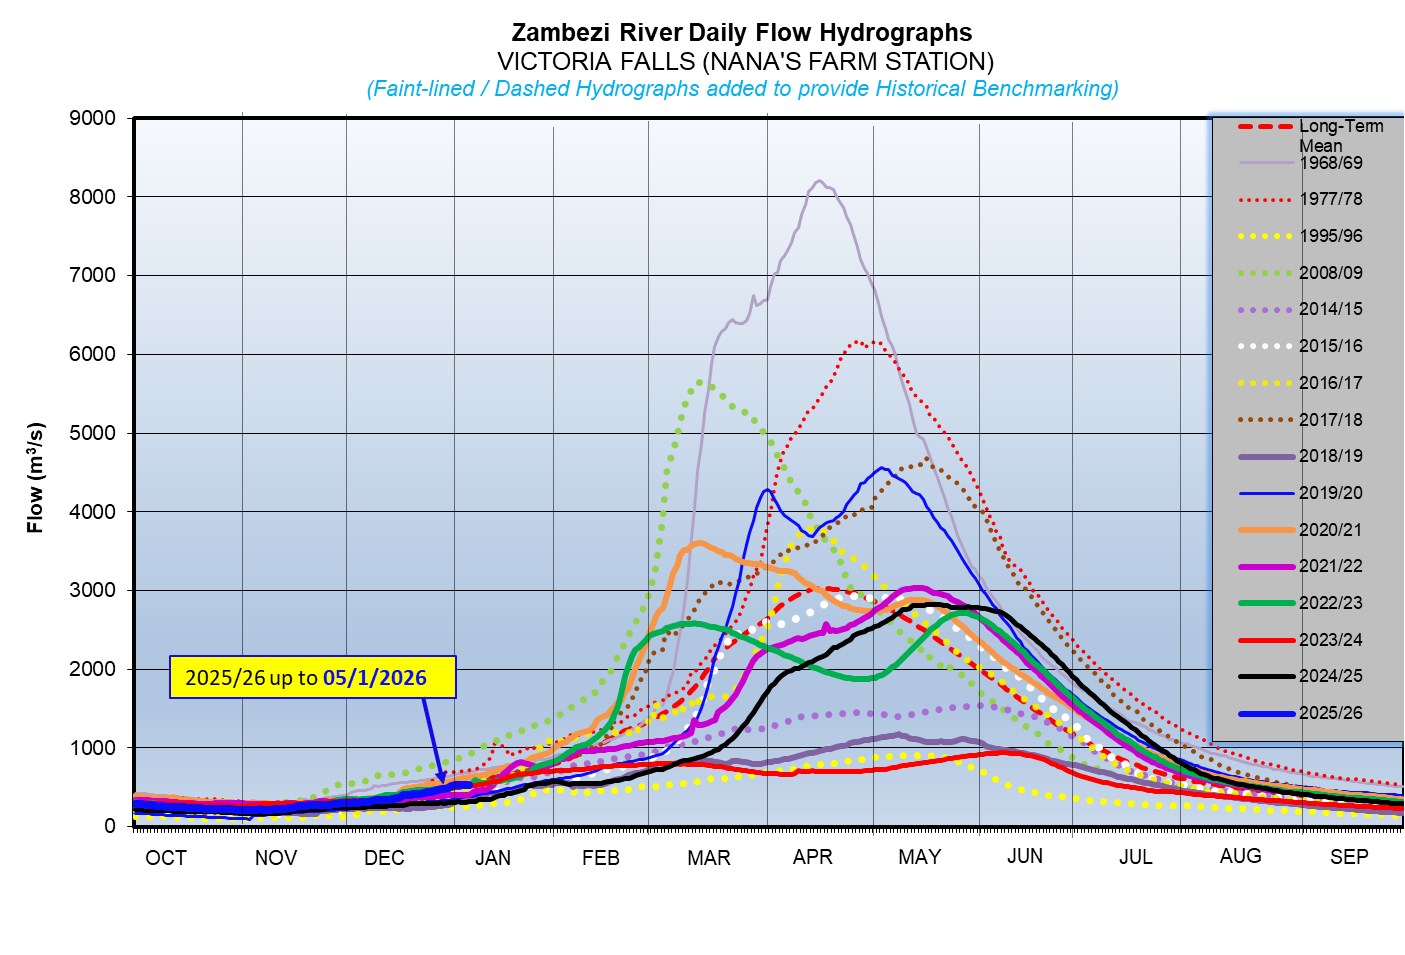
The Zambezi River flows at Victoria Falls – Nana’s Farm Station are increasing steadily, closing the period under review at 615m3/s on 20th February 2025.  The flow observed on the same date last year was higher at 778m3/s.

From:
14 February 2025
To:
20 February 2025
DateFlow (m3/s)(2024/25)Flow (m3/s)(2023/24)
14-Feb575763
15-Feb575766
16-Feb587770
17-Feb591772
18-Feb598775
19-Feb606773
20-Feb615778
vic-falls