Hydrology Banner

Victoria Falls / Big Tree

Flows at Victoria Falls have been decreasing closing the week under review at 177m3/s on 12th November 2018. Coincidentally, Last year on the same date, the flow was also 177m3/s.  

Date Flow(m3/s)
06/11/2018192
07/11/2018189
08/11/2018186
09/11/2018180
10/11/2018180
11/11/2018180
12/11/2018177
From: 
Tuesday, November 6, 2018
To: 
Monday, November 12, 2018
Lake Levels Graphic: 
vic falls

Chavuma

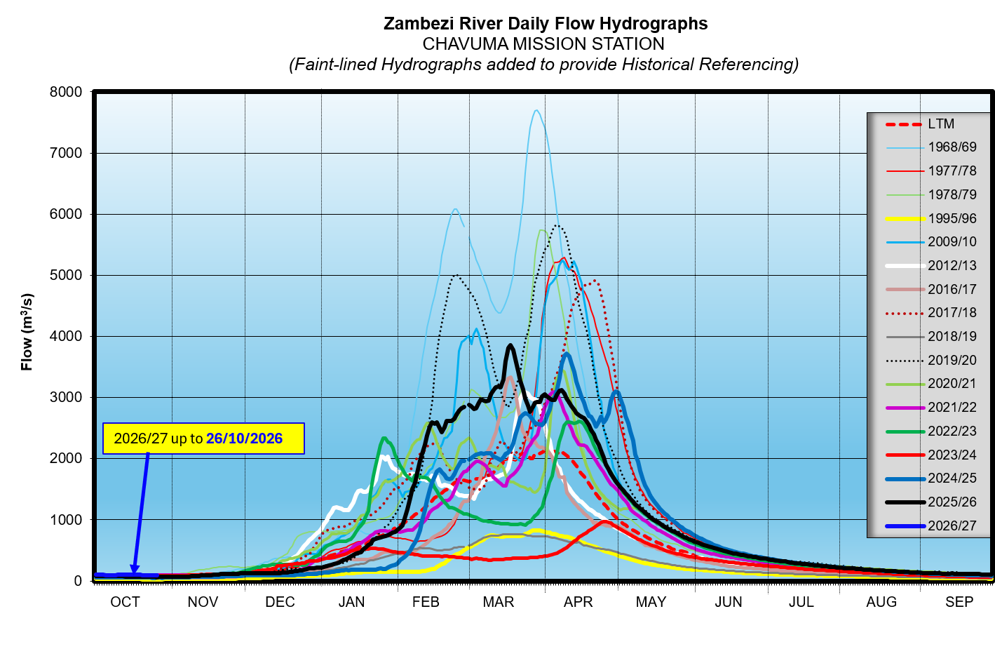
The Zambezi River flows at Chavuma are in recession, closing the period under review at 93m 3 /s as of 26 th October 2026, whilst last year on the same date it was at 63m 3 /s.

From:
13 October 2026
To:
26 October 2026
DateFlow (m3/s)(2025/26)Flow (m3/s)(2024/25)
13-Oct10274
14-Oct10172
15-Oct9972
16-Oct9970
17-Oct9968
18-Oct9868
19-Oct9866
20-Oct9765
21-Oct9664
22-Oct9664
23-Oct9666
24-Oct9665
25-Oct9464
26-Oct9363

Ngonye

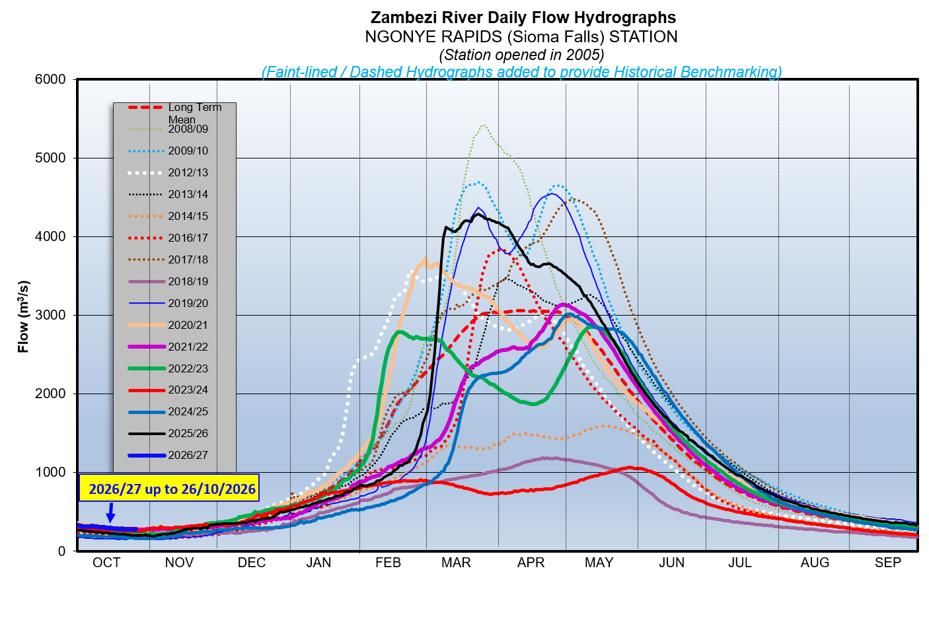
Flows at Ngonye are steadily decreasing, with isolated rises due to the influence of localised rainfall activity, closing the period under review at 276m3/s as of 26th October 2026. The flow recorded last year on the same date was at 202m3/s.

From:
13 October 2026
To:
26 October 2026
DateFlow (m3/s)(2025/26)Flow (m3/s)(2024/25)
13-Oct299236
14-Oct299230
15-Oct295228
16-Oct292227
17-Oct287222
18-Oct285220
19-Oct282216
20-Oct285214
21-Oct282214
22-Oct282206
23-Oct280205
24-Oct280203
25-Oct277203
26-Oct276202

Victoria Falls (Nana’s Farm Station)

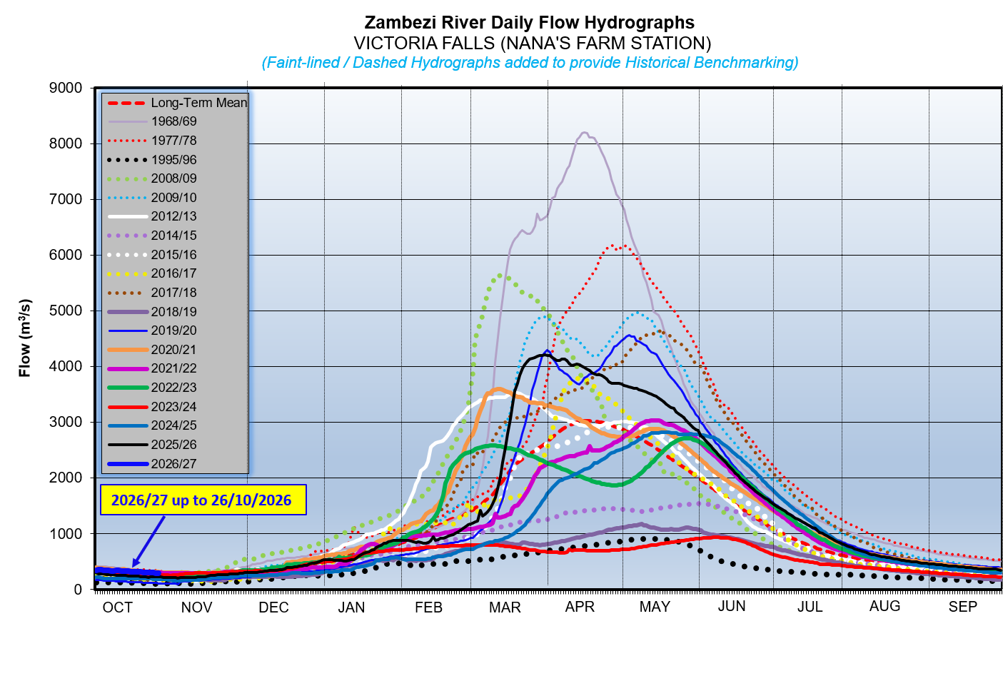
The Zambezi River flows at Victoria Falls – Nana’s Farm Station are steadily decreasing, closing the period under review at 296m3/s as of 26th October 2026.  The flow observed on the same date last year was at 223m3/s.

From:
13 October 2026
To:
26 October 2026
DateFlow (m3/s)(2025/26)Flow (m3/s)(2024/25)
13-Oct329252
14-Oct328247
15-Oct324243
16-Oct321241
17-Oct316240
18-Oct315236
19-Oct313233
20-Oct310230
21-Oct307225
22-Oct306221
23-Oct304225
24-Oct301226
25-Oct296225
26-Oct296223