Hydrology Banner

River Flows

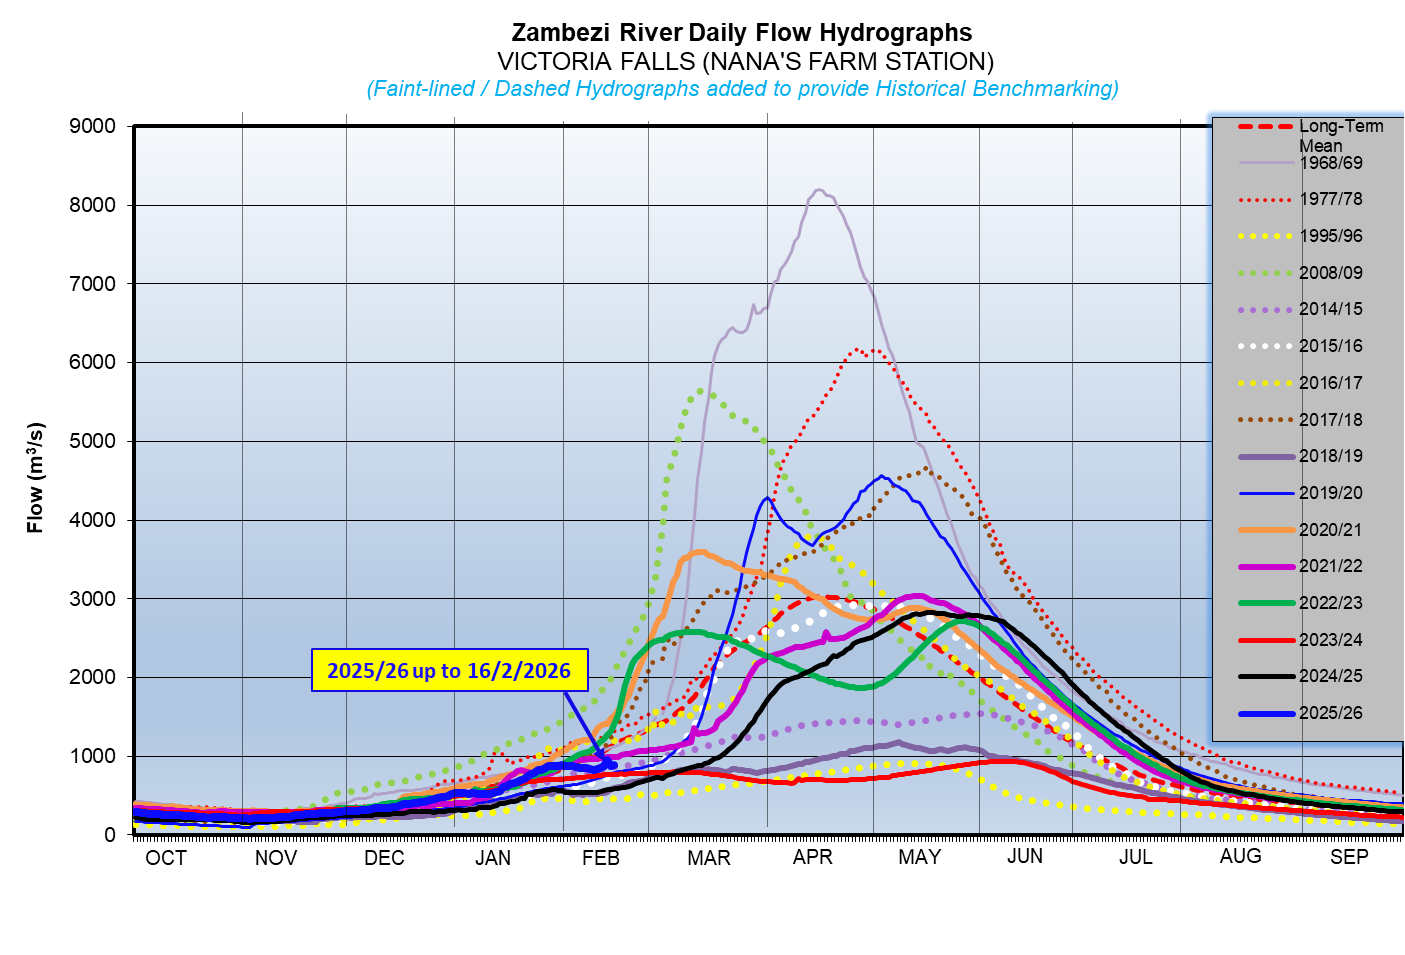
The hydrometric network used for the control and day to day operations of the Kariba reservoir comprise of thirteen stations where water levels are monitored daily. Flow measurements are carried out at eight of these stations which include the Victoria Falls, one of the key stations on the Zambezi River. Coincidentally, the maximum flow recorded at Victoria Falls was during the early construction phase of Kariba Dam in March 1958 at 10,000 cubic metres per second.  The lowest flows recorded to date at Victoria Falls were during the 1995/96 season which had an annual mean flow of 390 cubic metres per second, whereas the Long Term Mean Annual flow at Victoria Falls is 1,100 cubic metres per second.

FLOWS AT SELECTED STATIONS:

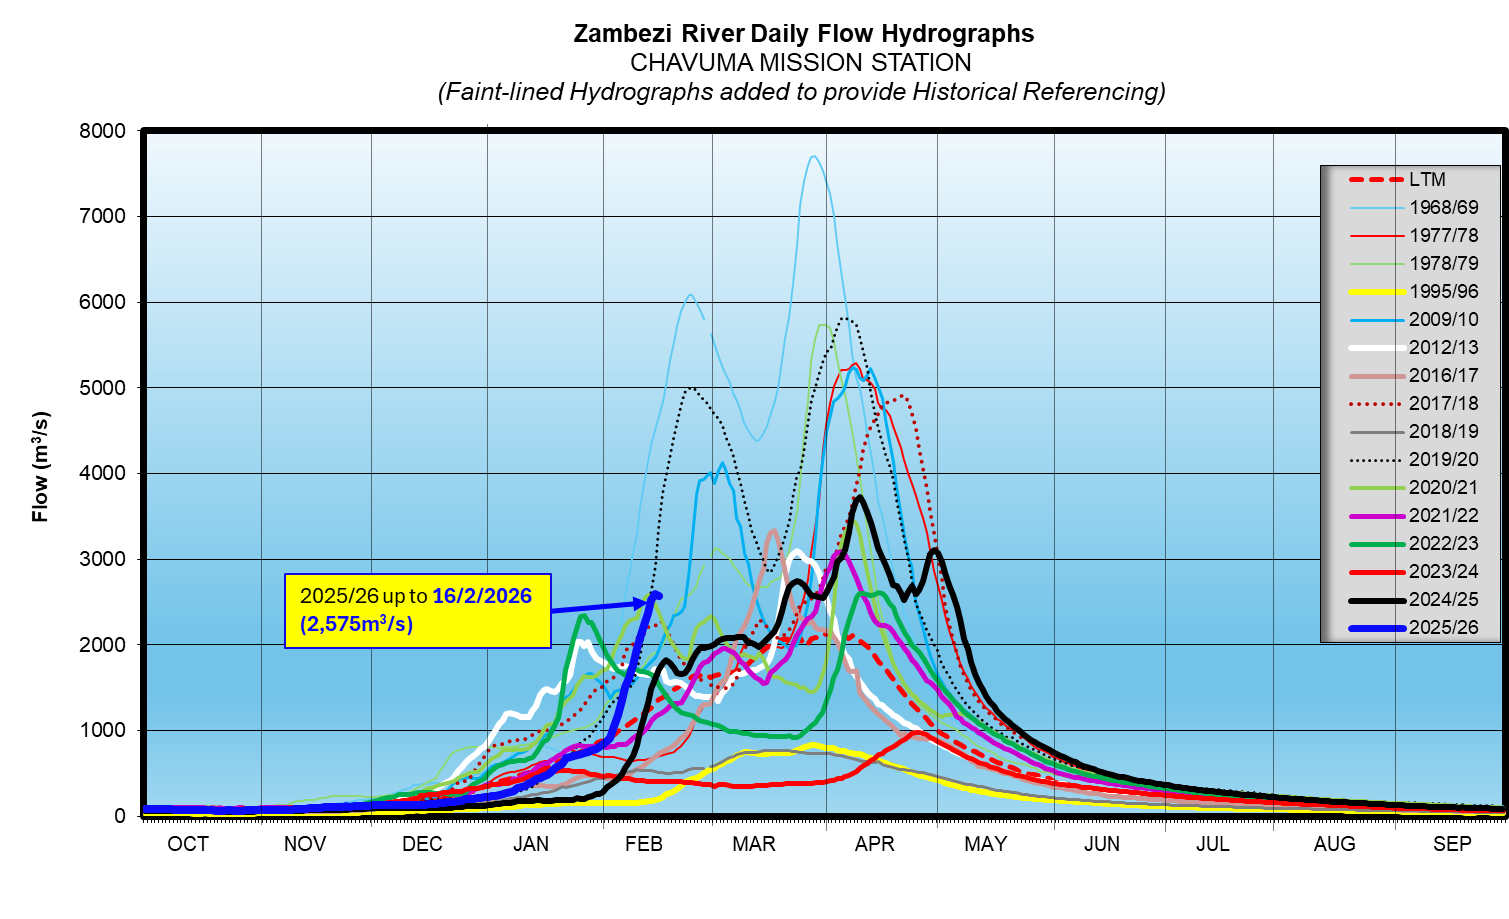
Chavuma

The Zambezi River flows at Chavuma are rising steadily, with records of fluctuations being observed due to the influence of local rainfall activity, closing the period under review at 70m3/s as of 3rd November 2025, whilst last year on the same date it was lower at 59m3/s.

From:
21 October 2025
To:
3 November 2025
DateFlow (m3/s)(2024/25)Flow (m3/s)(2023/24)
21-Oct6453
22-Oct6452
23-Oct6652
24-Oct6551
25-Oct6451
26-Oct6355
27-Oct6453
28-Oct6652
29-Oct6853
30-Oct6853
31-Oct6854
1-Nov6957
2-Nov7159
3-Nov7059

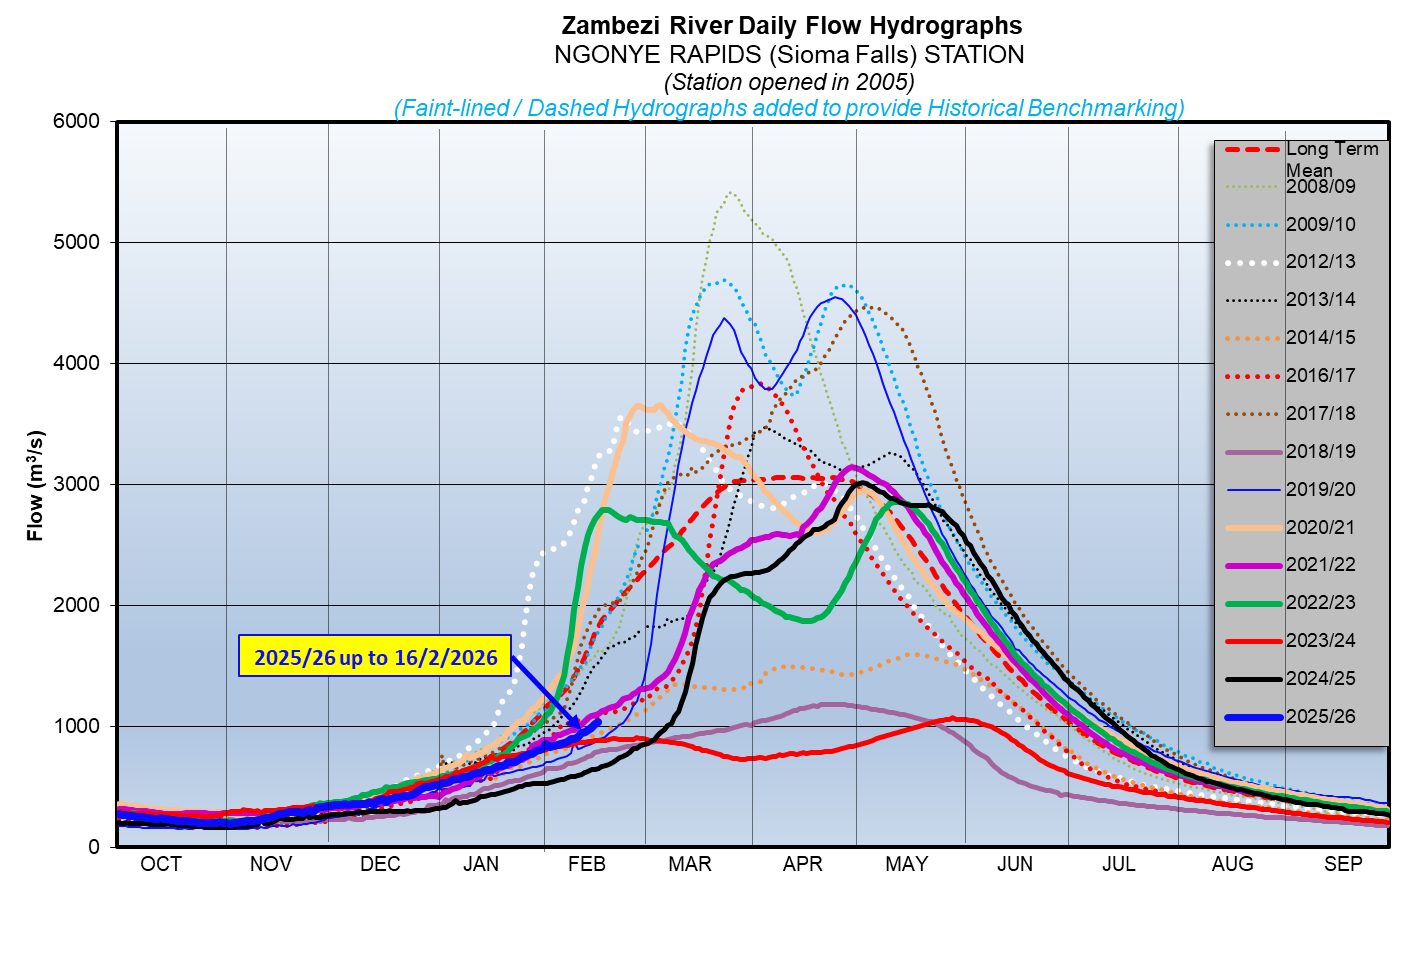
Ngonye

Flows at Ngonye are decreasing with records of fluctuation being observed due to local rainfall activity, closing the period under review at 195m3/s as of 3rd November 2025. The flow recorded last year on the same date was lower at 165m3/s.

From:
21 October 2025
To:
3 November 2025
DateFlow (m3/s)(2024/25)Flow (m3/s)(2023/24)
21-Oct214175
22-Oct206173
23-Oct205171
24-Oct203171
25-Oct203169
26-Oct202164
27-Oct199164
28-Oct196164
29-Oct203159
30-Oct206159
31-Oct199162
1-Nov198163
2-Nov194163
3-Nov195165

Victoria Falls (Nana’s Farm Station)

The Zambezi River flows at Victoria Falls – Nana’s Farm Station are in recession, with isolated rises being observed due to local rainfall activity, closing the period under review at 206m3/s as of 3rd November 2025.  The flow observed on the same date last year was lower at 162m3/s.

From:
21 October 2025
To:
3 November 2025
DateFlow (m3/s)(2024/25)Flow (m3/s)(2023/24)
21-Oct225195
22-Oct221193
23-Oct225190
24-Oct226186
25-Oct225186
26-Oct223184
27-Oct223184
28-Oct220180
29-Oct219178
30-Oct214174
31-Oct212169
1-Nov212163
2-Nov211162
3-Nov206162