Hydrology Banner

Victoria Falls / Big Tree

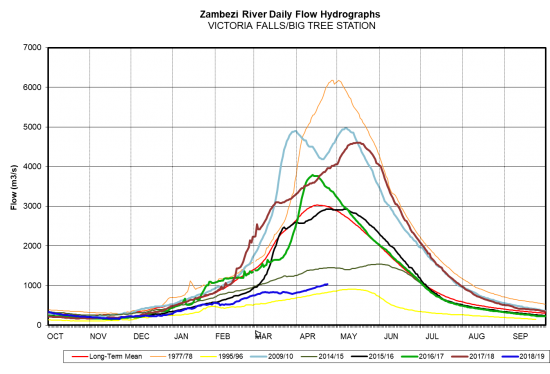
Flows at Victoria Falls increased steadily during the week under review before closing at 1,035m3/s on 23rd April 2019. Last year on the same date, the flow was 3,954m3/s.  

Date Flow(m3/s)
17/4/2019981
18/4/2019989
19/4/2019998
20/4/20191,007
21/4/20191,025
22/4/20191,025
23/4/20191,035
From: 
Wednesday, April 17, 2019
To: 
Tuesday, April 23, 2019
Lake Levels Graphic: 

Chavuma

The Zambezi River flows at Chavuma are rising steadily, with records of fluctuations being observed due to the influence of local rainfall activity, closing the period under review at 78m3/s as of 10th November 2025, whilst last year on the same date it was lower at 64m3/s.

From:
28 October 2025
To:
10 November 2025
DateFlow (m3/s)(2024/25)Flow (m3/s)(2023/24)
28-Oct6652
29-Oct6853
30-Oct6853
31-Oct6854
1-Nov6957
2-Nov7159
3-Nov7059
4-Nov7061
5-Nov6962
6-Nov7461
7-Nov7363
8-Nov7463
9-Nov7565
10-Nov7864

Ngonye

Flows at Ngonye are increasing with records of fluctuation being observed due to local rainfall activity, closing the period under review at 224m3/s as of 10th November 2025. The flow recorded last year on the same date was lower at 186m3/s.

From:
28 October 2025
To:
10 November 2025
DateFlow (m3/s)(2024/25)Flow (m3/s)(2023/24)
28-Oct6652
29-Oct6853
30-Oct6853
31-Oct6854
1-Nov6957
2-Nov7159
3-Nov7059
4-Nov7061
5-Nov6962
6-Nov7461
7-Nov7363
8-Nov7463
9-Nov7565
10-Nov7864

Victoria Falls (Nana’s Farm Station)

The Zambezi River flows at Victoria Falls – Nana’s Farm Station are in recession, with isolated rises being observed due to local rainfall activity, closing the period under review at 219m3/s as of 10th November 2025.  The flow observed on the same date last year was lower at 171m3/s.

From:
28 October 2025
To:
10 November 2025
DateFlow (m3/s)(2024/25)Flow (m3/s)(2023/24)
28-Oct220180
29-Oct219178
30-Oct214174
31-Oct212169
1-Nov212163
2-Nov211162
3-Nov206162
4-Nov212164
5-Nov217166
6-Nov220167
7-Nov216168
8-Nov216170
9-Nov217172
10-Nov219171